FIGURE SUMMARY
Title

MITF reprograms the extracellular matrix and focal adhesion in melanoma

Authors
Dilshat, R., Fock, V., Kenny, C., Gerritsen, I., Lasseur, R.M.J., Travnickova, J., Eichhoff, O.M., Cerny, P., Möller, K., Sigurbjörnsdóttir, S., Kirty, K., Einarsdottir, B.Ó., Cheng, P.F., Levesque, M., Cornell, R.A., Patton, E.E., Larue, L., de Tayrac, M., Magnúsdóttir, E., Helga Ögmundsdóttir, M., Steingrimsson, E.
Source
Full text @ Elife

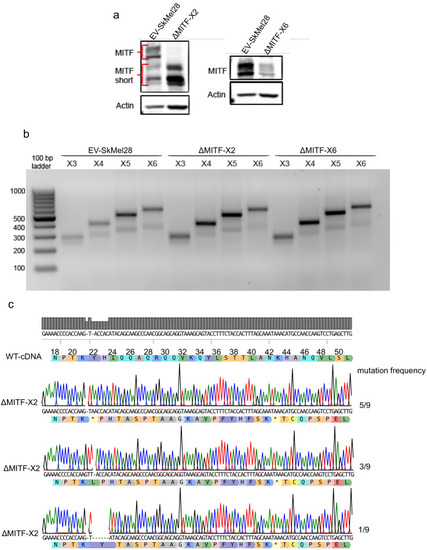
MITF depletion affects cell size and cell-matrix interaction. (a) Schematic illustration of MITF-M isoform and gRNA targeted location at exon 2 and exon 6. The epitope location for MITF C5 antibody spanning exons 4 and 5 is shown. (b, c) Mutations detected in ∆MITF-X2 and ∆MITF-X6 cell lines; amino acid sequence numbering was indexed relative to MITF-M. Percentage of mutations was derived from WGS analysis by counting sequenced fragments aligned to the mutated regions. (d) Western blot showing the MITF band in EV-SkMel28, ∆MITF-X2, and ∆MITF-X6 cell lines. (e) Immunostaining for MITF and Vimentin in EV-SkMel28, ∆MITF-X2, and ∆MITF-X6 cell lines, scale bar (10 µm). (f, g) Phase-contrast microscopy and cell size quantification using Image J with at least 200 images taken for both MITF-KO and EV-SkMel28 cell lines, scale bar (10 µm). Average cell size for each cell line is indicated by dashed lines; EV-SkMel28 cells (6502 µm2, SEM: 460), ΔMITF-X2 (10,395 µm2, SEM: 270) and the ΔMITF-X6 (10,825 µm2, SEM: 330). (h) Bright-field images of MITF-KO and EV-SkMel28 cells grown on top of matrigel, scale bar (10 µm).

Analysis of MITF mRNA and protein in MITF-KO cells.

(a) Western blot analysis for MITF and Actin in EV-SkMel28, ∆MITF-X2, and ∆MITF-X6 cells. (b) PCR product of exon 3, 4, 5, and 6 of MITF using cDNA generated from 5’RACE experiment. (c) Sequence alignment of clones generated from cloning cDNA fragments isolated from ∆MITF-X2 and EV-SkMel28 cells.

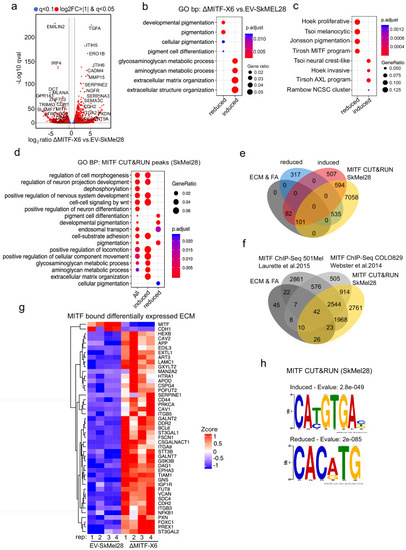
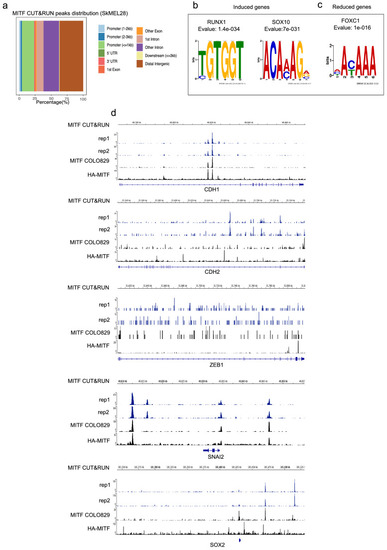
MITF binds and represses genes of extracellular matrix (ECM) and focal adhesion genes. (a) Volcano plot showing 2136 DEGs with qval <0.5 among which 1516 genes with log2FC≥|1| fold change in expression ∆MITF-X6 vs. EV-SkMel28. (b) GO BP analysis of the 1284 induced and 852 reduced DEGs between ∆MITF-X6 vs. EV-SkMel28 cells presented in dot plot; adjusted p-value is red lowest to blue highest; gene ratio is the ratio between DEGs and all genes in the GO category. (c) Dot plot of enrichment analysis showing the enrichment of gene signatures from the literature in reduced and induced DEGs of ∆MITF-X6 vs. EV-SkMel28. p Value is red lowest to blue highest; gene ratio is the ratio between genes and all genes in the GO category; reduced: genes reduced in expression in ∆MITF-X6 compared to EV-SkMel28; induced: genes induced in expression in the ∆MITF-X6 compared to EV-SkMel28. (d) GO BP analysis of MITF CUT and RUN peaks associated genes were plotted using Clusterprofiler (Yu et al., 2012) in R; All: MITF CUT and RUN peak-associated genes, induced and reduced: Induced or reduced DEGs of ∆MITF-X6 vs. EV-SkMel28 cells based on MITF CUT and RUN peak presence on their gene promoter or distal region binding. (e) Venn diagram showing the overlap between MITF targets identified from MITF CUT and RUN with induced, reduced, ECM and focal adhesion DEGs of ∆MITF-X6 vs. EV-SkMel28 cells. (f) Venn diagram displaying the common overlap between MITF ChIP-seq targets in different cell lines and differentially expressed ECM and focal adhesion genes in ∆MITF-X6 vs. EV-SkMel28 cells. (g) Heatmap showing the differentially expressed ECM genes in ∆MITF-X6 vs. EV-SkMel28 cells that are commonly bound by MITF across different MITF CUT and RUN data sets. Zcore converted TPM value from RNA-seq data was used for plotting. (h) Motif analysis of MITF CUT-and-RUN targets of induced and reduced genes in ∆MITF-X6 vs. EV-SkMel28 cells.

MITF CUT&RUN peak distribution and motifs.

(a) Bar graph displaying the percentage of genome wide MITF CUT&RUN peak distribution. (b, c) Motif analysis of MITF peaks on reduced and induced DEGs in ΔMITF-X6 vs. EV-SkMel28 cells using MEMEChIP. E-value is a measure of the expected number of motifs with the same size occurring in the random database. (d) View of MITF CUT and RUN in SkMEL28 (rep1 and rep2), MITF ChIP-seq in COLO829 cells (Webster et al., 2014), and HA-MITF ChIP-Seq in 501Mel (Laurette et al., 2015) loaded in IGV genome browser indicating MITF peaks in CDH1, CDH2, ZEB1, SNAI2 and SOX2.

MITF directly regulates NGFR and MLANA expression.

(a, b) Gene expression of NGFR and MLANA measured by RT-qPCR in EV-SkMel28, ∆MITF-X2, and ∆MITF-X6 cell lines. Expression was normalized to EV-SkMel28 cells. Error bars represent standard error of the mean, * p value <0.05 was calculated by one-way ANOVA (multiple correction with Dunnett test). (c, d) IGV genome browser showing MITF ChIP-seq tracks from MITF CUT and RUN in SkMEL28 (rep1 and rep2), MITF ChIP-seq in COLO829 cells (Webster et al., 2014), and HA-MITF ChIP-seq in 501Mel (Laurette et al., 2015) in NGFR and MLANA.

The extracellular matrix (ECM) and focal adhesion gene signature is overrepresented upon MITF depletion and in MITF<sup>low</sup> human melanoma tumors.

(a–d) Positive correlation of DEGs in ∆MITF-X6 vs. EV-SkMel28 cells with DEGs of siMITF vs. siCTRL in 501Mel and SkMel28 and MITFlow vs. MITFhigh melanoma tumors from TCGA, and negative correlation of DEGs in pB-FLAG vs. pB-MITF-FLAG A375P cells is shown. Values used in the X and Y axis are log2 fold change in the expression of DEGs. (e) Principal component analysis (PCA) of the 200 most significant DEGs in the MITFlow vs. MITFhigh and ∆MITF-X6 vs. EV-SkMel28 display similar clustering where EV-SkMel28 samples cluster with MITFhigh tumors and ∆MITF-X6 cells with MITFlow tumors. (f) GO BP analysis of induced and reduced DEGs affected by MITF KO/KD in SkMel28 and 501Mel cells, and DEGs affected by MITF overexpression in A375P cells. (g) Venn diagram displaying the overlap in the number of differentially expressed ECM genes affected by MITF and MITF CUT-and-RUN targets. (h) RT-qPCR showing reduced expression of ECM genes in the stable dox-inducible MITF overexpression A375P cell line (pB-MITF-FLAG). Relative expression was calculated by normalizing to control cells expressing empty vector (pB-FLAG). Error bars indicate standard error of the mean (* p value <0.05) was calculated using paired t-test. (i) Gene set enrichment analysis using ECM genes differentially expressed between ∆MITF-X6 and EV-SkMel28 cells in the top 30 MITFlow and 30 MITFhigh samples with high fibroblast marker removed Primary, and metastatic melanoma from TCGA were analyzed separately. (j) Percentage of mutations in the indicated genes in the MITFlow and MITFhigh tumors from fibroblast-free, primary and metastatic TCGA tumor samples, respectively.

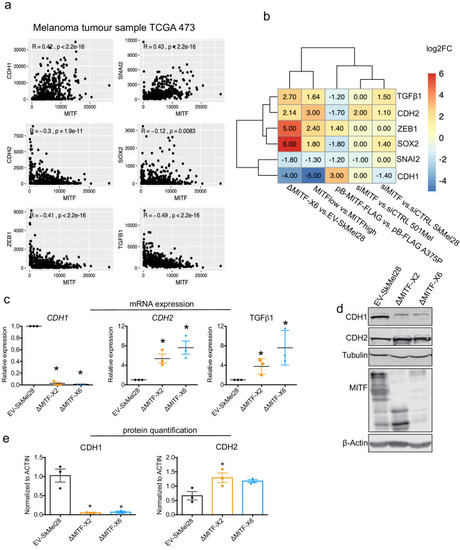
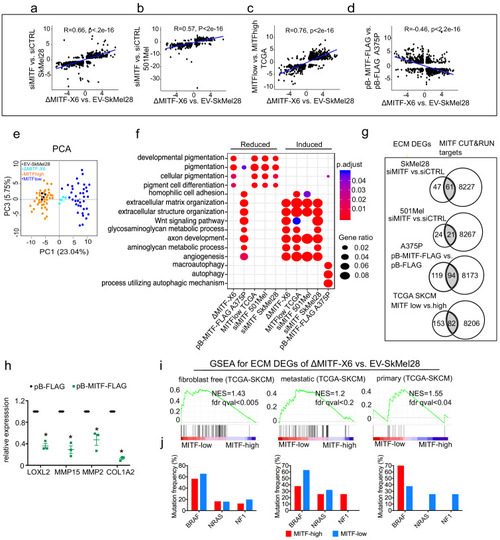
Epithelial-to-mesenchymal transition (EMT) genes are directly regulated by MITF. (a) Scatter plot displaying the Spearman correlation between MITF mRNA expression with EMT genes in the 472 melanoma tumor samples from TCGA; MITF displayed positive correlation with CDH1 and SNAI2 and negative correlation with ZEB1, TGFß1, and CDH2. (b) Differentially expressed EMT genes plotted as heatmap using the log2 fold change value of DEGs of MITF depletion in SkMel28 and 501Mel cells, MITF overexpression in A375P cells and MITFlow&high melanoma tumors. (c) Real-time qPCR (RT-qPCR) evaluation of EMT genes in the EV-SkMel28, ∆MITF-X2, and ∆MITF-X6 cell lines. Fold change in the expression calculated over EV-SkMel28. Error bar represents standard error of the mean (* p value <0.05) was calculated using one-way ANOVA (multiple correction with Dunnett test). (d, e) Western blot analysis and quantification (Fiji Image J) of protein expression of CDH1, CDH2, and MITF in EV-SkMel28, ∆MITF-X2, and ∆MITF-X6 cell lines. ß-Actin was used as loading control. * p value <0.05 was calculated by one-way ANOVA (multiple correction with Dunnett test).

The effects of MITF on epithelial-to-mesenchymal transition (EMT) and extracellular matrix (ECM) gene expression are reversible.

(a–d) Gene expression of ECM and EMT genes evaluated by RT-qPCR in EV-SkMel28 and MITF-KO cells with ectopic expression of EV-FLAG and MITF-FLAG constructs. Expression was normalized to EV-SkMel28 cells. Error bars represent standard error of the mean, * p value <0.05 was calculated by two-way ANOVA (multiple correction with Sidak test). (e) Schematic showing the dox-inducible MITF KD system. MITF expression decreases in the presence of dox (first 24 hr) and reverts back to baseline levels upon dox wash-off (at 72–96 hr). (f) Western blot analysis for the protein expression of MITF and CDH1, and CDH2 with the presence of dox treatment 0 and 24 hr or absence of dox 72 and 96 hr. (g–j) RT-qPCR analysis of MITF targeted ECM genes in miR-NTC and miR-MITF SkMel28 cells, treated with dox for 24 hr to induce MITF KD and after dox wash-off at 72 and 96 hr. Expression was normalised to miR-NTC cell lines, error bars represent standard error of the mean, * p value <0.05 was calculated by two-way ANOVA (multiple correction with Sidak test).

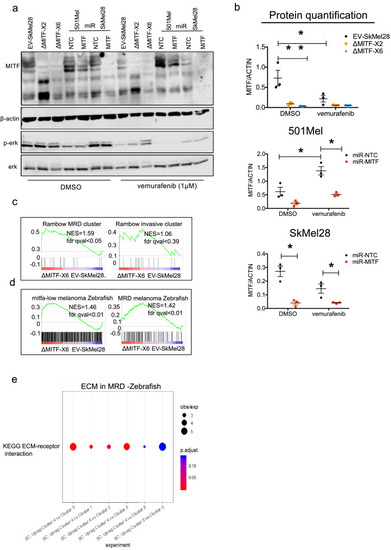
MITF mediates formation of focal adhesion. (a–b) Immunostaining for p-PXNTYR118 and quantification of p-PXNTYR118-positive focal points in EV-SkMel28, ∆MITF-X2 and ∆MITF-X6 cell lines treated with DMSO (a, upper panel) or vemurafenib (a, lower panel). (c–d) Immunostaining for p-PXNTYR118 and MITF and (e, f) quantification of p-PXNTYR118-positive focal points in miR-NTC and miR-MITF treated 501Mel and SkMel28 cells. Error bars represent standard error of the mean, * p value <0.05 was calculated by two-way ANOVA (multiple correction with Sidak test). (g) Bar plot represents the relative viable cells compared to DMSO control with increasing concentration of FAK inhibitor (PF562271) for 72 hr. Error bars represent standard error of the mean, * p value <0.05 was calculated by two-way ANOVA (multiple correction with Tukey test). (h) Incucyte images of cells after 72 hr treatment with increasing concentrations of FAKi (PF562271) and with respective DMSO control.

MITF represses PXN in melanoma cell lines.

(a) Immunostaining for p-PXNTYR118 and quantification of p-PXNTYR118-positive focal points in EV-SkMel28, ∆MITF-X2, and ∆MITF-X6 cell lines. Error bars represents standard error of the mean, * p value <0.05 was calculated by one-way ANOVA (multiple correction with Dunnett test). (c) Co-expression of MITF mRNA and PXN expression in the 473 melanoma tumor samples displayed in the scatter plot with negative Pearson correlation coefficient. (d) Expression of MITF and PXN across 168 melanoma cell lines. Mutations are indicated for each cell line in colors (red:BRAF, orange:NRAS, yellow:cKIT, lime:double, green: WT, and blue: GNA11). (e) Negative correlation of MITF and PXN mRNA expression in 168 melanoma cell lines. (f–h) Immunostaining for p-PXNTYR118 and MITF; Quantification of p-PXNTYR118-positive focal points in miR-NTC and miR-MITF 501Mel and SkMel28 cells. (i) View of MITF ChIP-seq peaks in PXN from MITF CUT and RUN in SkMEL28 (rep1 and rep2), MITF ChIP-seq in COLO829 cells (Webster et al., 2014), and HA-MITF ChIP-seq in 501Mel (Laurette et al., 2015) loaded in IGV genome browser.

MITF-KO cells mimic MRD in melanoma.

(a, b) Western blot analysis and quantification of MITF, ERK and p-ERK in EV-SkMel28, ΔMITF-X2, ΔMITF-X6 and miR-NTC, miR-MITF in SkMEL28 and 501Mel cell lines treated with DMSO or vemurafenib (1 µM) for 24 hr. Actin was used as loading control. (c, d) GSEA analysis using DEGs of ∆MITF-X6 vs. EV-SkMel28 cells on Rambow MRD and invasive gene signatures and MRD signature from Zebrafish and mitfalow melanoma tumors. (e) Gene enrichment analysis plotted using Cluster profiler of single cell clusters obtained from melanoma tumors in zebrafish.

MITF knockout affects proliferation, migration, and invasion ability of melanoma cells.

(a) Relative cell confluency obtained from IncuCyte live cell imaging compared to day 0 was plotted for EV-SkMel28, ΔMITF-X2, and ΔMITF-X6 cell lines; Error bars represent standard error of the mean, * p value <0.05 was calculated by one-way ANOVA. (b) Percentage of BrdU-positive cells was assessed by flow cytometry in EV-SkMel28, ∆MITF-X2, and ∆MITF-X6 cell lines. Error bars represent standard error of the mean, * p value <0.05 was calculated by one-way ANOVA (multiple correction with Dunnett test). (c, d) Quantification and images of wound scratch assay in EV-SkMel28, ΔMITF-X2, and ΔMITF-X6 cells over 24 hr time period. Error bars represent standard error of the mean, * p value <0.05 was calculated by two-way ANOVA (multiple correction with Sidak test). (e, f) Quantification and images of wound scratch assay in miR-NTC and miR-MITF in SkMel28 cells over 12 hr time period. Error bars represent standard error of the mean, * p value <0.05 was calculated by one-way ANOVA (multiple correction with Sidak test). (g, h) Matrigel invasion assay of EV-SkMel28, ∆MITF-X2, and ∆MITF-X6 cells using the transwell assay; Quantification of invaded cells per transwell filter. Error bars represent standard error of the mean, * p value <0.05 was calculated by one-way ANOVA (multiple correction with Dunnett test).

Quantification of cell proliferation, migration and invasion of MITF-KO and KD cells.

Acknowledgments
This image is the copyrighted work of the attributed author or publisher, and ZFIN has permission only to display this image to its users. Additional permissions should be obtained from the applicable author or publisher of the image. Full text @ Elife