
- Title
-
Rapid and efficient cataract gene evaluation in F0 zebrafish using CRISPR-Cas9 ribonucleoprotein complexes
- Authors
- Zhao, D., Jones, J.L., Gasperini, R.J., Charlesworth, J.C., Liu, G.S., Burdon, K.P.
- Source
- Full text @ Methods
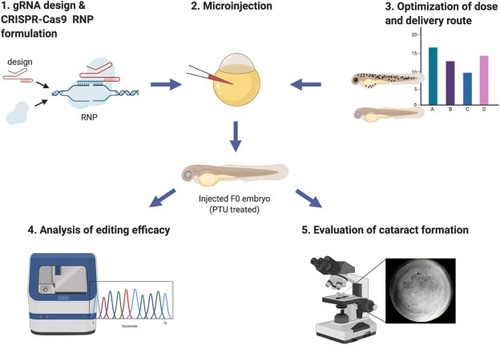
Fig. 1. Overview of the main steps of the cataract gene evaluation pipeline. Each step corresponds to a section of the protocol with the same title. |
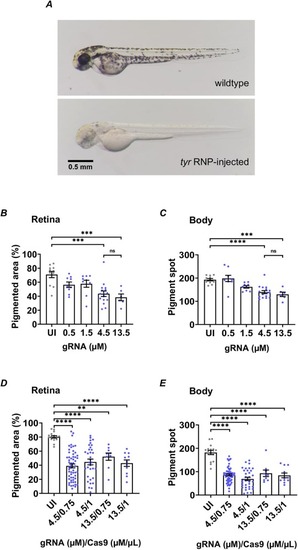
Fig. 2. CRISPR-Cas9 RNP dose optimization. A. Zebrafish embryos at 2dpf. Embryos injected with CRISPR-Cas9 RNP against tyr gene (bottom) had observable pigment loss compare to uninjected wildtype zebrafish (top). B and C. Optimization of tyr gRNA concentration (UI: n = 11, 0.5 μM: n = 9, 1.5 μM: n = 9, 4.5 μM: n = 16, 13.5 μM: n = 6). D and E. Optimization of Cas9 concentration (UI: n = 16, 4.5 μM/0.75 μg/μl: n = 57, 4.5 μM/1μg/μl: n = 33, 13.5 μM/0.75 μg/μl: n = 9, 13.5 μM/1μg/μl: n = 11). The pigment areas on the retina (B, D) and body (C, E) of zebrafish injected with a series of different concentrations of tyr gRNA or Cas9 were measured and compared (UI: uninjected; **p < 0.01, ***p < 0.001, ****p < 0.0001; ns: not significant; one-way ANOVA and Tukey’s multiple comparisons test; Mean ± SEM). PHENOTYPE:
|
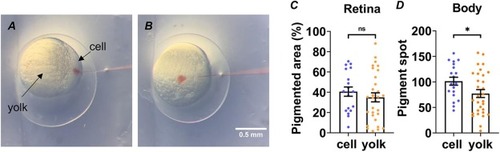
Fig. 3. CRISPR-Cas9 RNP delivery route optimization. A and B. Illustrations of cell injection (A) and yolk injection (B). The zebrafish embryos were cell-injected (n = 19) or yolk-injected (n = 30) with tyr RNP. The pigment areas on the retina (C) and body (D) of zebrafish in the cell injection group and yolk injection group were measured and compared. (*p < 0.05, ns: not significant; unpaired two-tailed t-test; Mean ± SEM). PHENOTYPE:
|
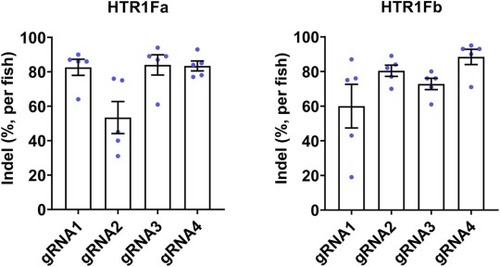
Fig. 4. Editing efficiency analysis for individual gRNA. 5 injected larvae were randomly selected at 4dpf from each gRNA injected group, and the target region of individual embryos was amplified and analyzed for indel percentage. |
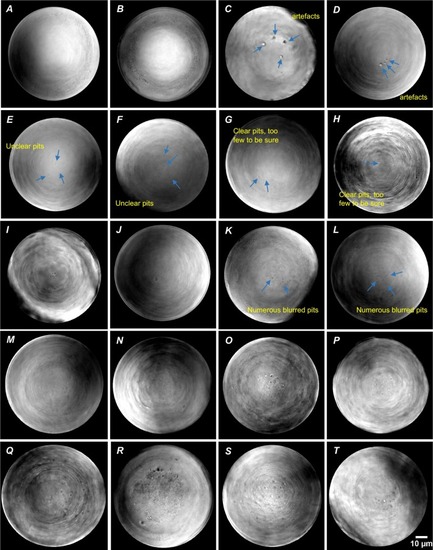
Fig. 5. Zebrafish cataract assessment criteria (pitting). PHENOTYPE:
|
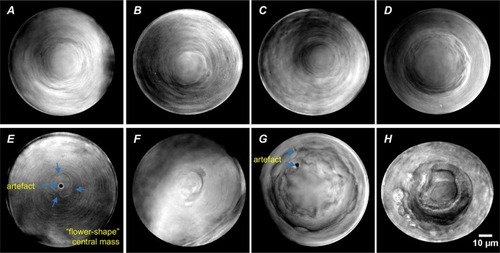
Fig. 6. Zebrafish cataract assessment criteria (central mass). PHENOTYPE:
|

Fig. 7. Normal developing lens images with maturing lens fiber cells. |