
Image
|
Figure Caption
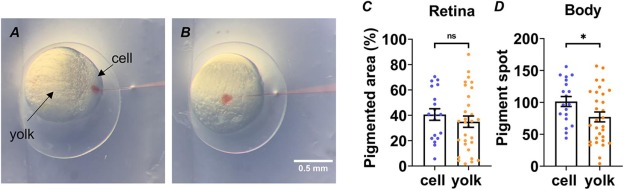
Fig. 3
Fig. 3. CRISPR-Cas9 RNP delivery route optimization. A and B. Illustrations of cell injection (A) and yolk injection (B). The zebrafish embryos were cell-injected (n = 19) or yolk-injected (n = 30) with tyr RNP. The pigment areas on the retina (C) and body (D) of zebrafish in the cell injection group and yolk injection group were measured and compared. (*p < 0.05, ns: not significant; unpaired two-tailed t-test; Mean ± SEM).
Figure Data
Acknowledgments
This image is the copyrighted work of the attributed author or publisher, and
ZFIN has permission only to display this image to its users.
Additional permissions should be obtained from the applicable author or publisher of the image.
Full text @ Methods