
|
Fig. 2
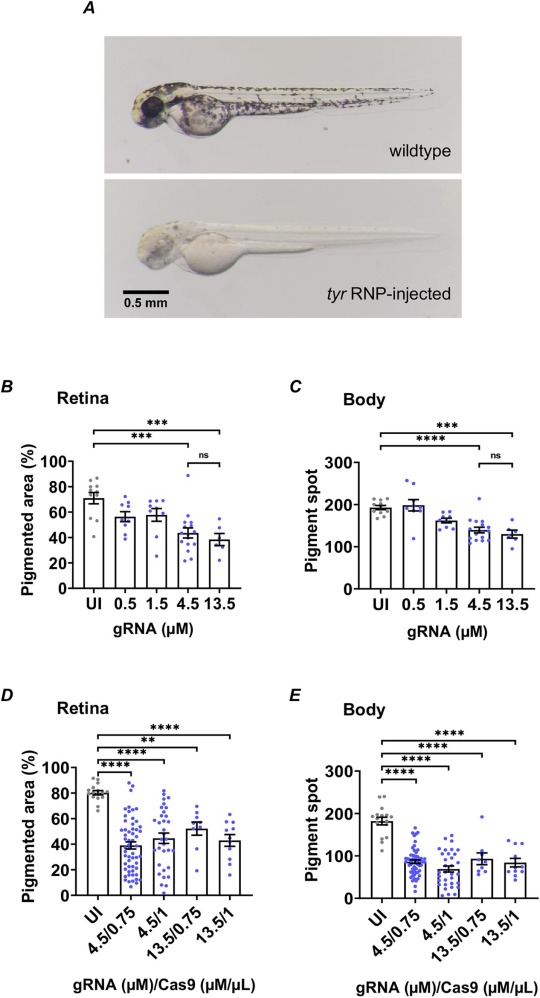
Fig. 2. CRISPR-Cas9 RNP dose optimization. A. Zebrafish embryos at 2dpf. Embryos injected with CRISPR-Cas9 RNP against tyr gene (bottom) had observable pigment loss compare to uninjected wildtype zebrafish (top). B and C. Optimization of tyr gRNA concentration (UI: n = 11, 0.5 μM: n = 9, 1.5 μM: n = 9, 4.5 μM: n = 16, 13.5 μM: n = 6). D and E. Optimization of Cas9 concentration (UI: n = 16, 4.5 μM/0.75 μg/μl: n = 57, 4.5 μM/1μg/μl: n = 33, 13.5 μM/0.75 μg/μl: n = 9, 13.5 μM/1μg/μl: n = 11). The pigment areas on the retina (B, D) and body (C, E) of zebrafish injected with a series of different concentrations of tyr gRNA or Cas9 were measured and compared (UI: uninjected; **p < 0.01, ***p < 0.001, ****p < 0.0001; ns: not significant; one-way ANOVA and Tukey’s multiple comparisons test; Mean ± SEM).