
- Title
-
Sodium dehydroacetate induces cardiovascular toxicity associated with Ca2+ imbalance in zebrafish
- Authors
- Huang, X., Zhao, X., Zhu, K., Ding, S., Shao, B.
- Source
- Full text @ Ecotoxicol. Environ. Saf.
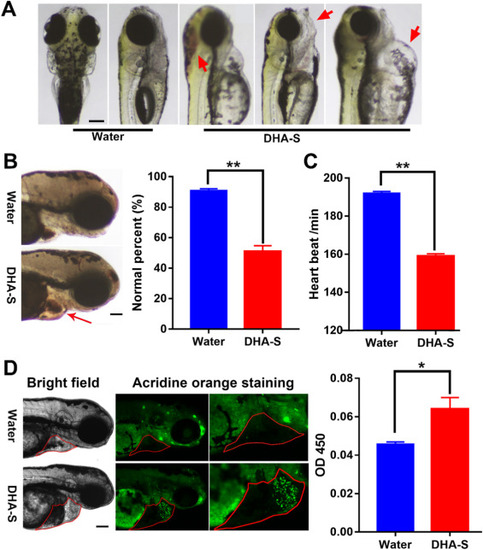
Fig. 1. DHA-S induces cardiovascular toxicity in zebrafish larvae. A, Representative pictures of DHA-S induced cerebral hemorrhage, mandibular dysplasia and pericardial edema in zebrafish during the exposure. B, Images of O-dianisidine-stained globin (representing erythrocytes) in zebrafish heart after 24 h of exposure (48–72 h post-fertilization) in water or 50 mg/L DHA-S. Right, quantification of DHA-S-treated and control groups. C, Heartbeat per minute of 10 zebrafish recorded and quantified. The difference between DHA-S-treated group and control group was analyzed by Student’s unpaired T test. D, Images of acridine orange-stained zebrafish larvae demonstrating apoptosis in hearts. The red dashed line indicates the cardiac region. Right, pooled data for the AO fluorescence intensity in whole zebrafish. In B and D groups, scale bar, 100 µm; n = 3, each group containing 20 embryos. All the data are expressed as mean ± SEM. *, P < 0.05; and **, P < 0.01; analyzed by Student’s unpaired T test. (For interpretation of the references to colour in this figure legend, the reader is referred to the web version of this article.) |
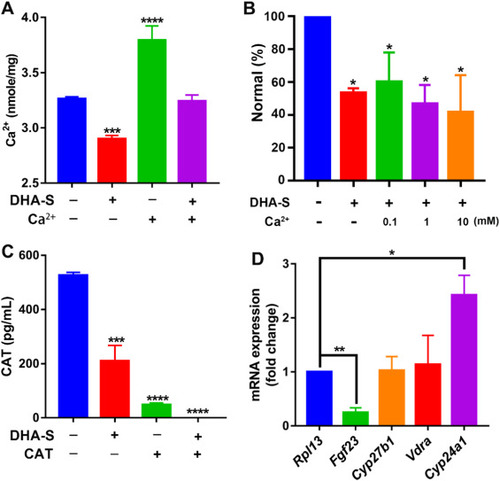
Fig. 2. DHA-S induced Ca2+ deficiency in zebrafish. A, The total whole body Ca2+ content in zebrafish after 24 h exposure (48–72 hpf) with or without 50 mg/L DHA-S and exogenous addition of Ca2+. Data were analyzed by one-way analysis of variance (ANOVA) test (F (3, 8) = 77.56; P < 0.0001). B, The normal percent of zebrafish after 24 h exposure (48–72 hpf) with or without 50 mg/L DHA-S and exogenous addition of Ca2+. Data were analyzed by one-way analysis of variance (ANOVA) test (F (4, 10) = 8.299; P = 0.0032). C, The levels of active 1,25(OH)2D3 (calcitriol, CAT) in zebrafish with or without 50 mg/L DHA-S for 24 h (48–72 hpf) and exogenous addition of CAT. Data were analyzed by one-way analysis of variance (ANOVA) test (F (3, 8) = 66.17; P < 0.0001). D, Relative mRNA levels (to Rpl13) of ion-regulated and vitamin D3-related genes. Data were analyzed by two-tailed, unpaired Student's t-test. In A, B, C and D, n = 3, each group containing more than 35 larvae. All the data are expressed as mean ± SEM. *, P < 0.05; and **, P < 0.01; *** , P < 0.001; and ****, P < 0.0001; untreated control versus treated groups. |
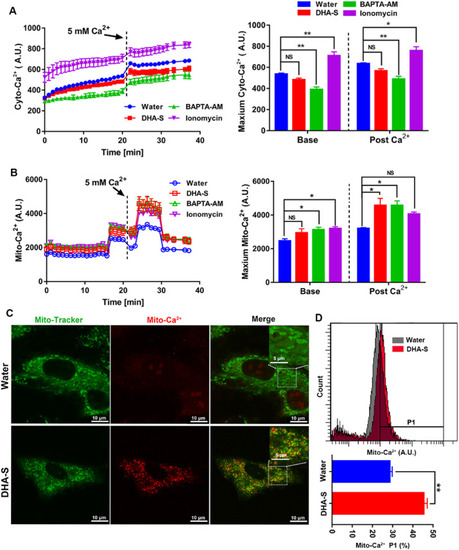
Fig. 3. DHA-S evoked mitochondrial Ca2+ accumulated in H9c2 cells. A, Dynamic change of cytoplasm Ca2+ was determined by Fluo3-AM. Right, quantification of the Fluo3 fluorescence intensity before and after adding Ca2+ (5 mM). Data were analyzed by one-way analysis of variance (ANOVA) test; F (3, 8) = 33.8 and F (3, 8) = 20.97 for the base and post Ca2+, respectively. H9c2 treated with the DHA-S (1 g/L, about 5 mM) in EBSS. BAPTA-AM and ionomycin were utilized as negative and positive control, respectively. B, Dynamic change of mitochondrial Ca2+ was determined by Rhod2-AM. Right, quantification of the Rhod2 fluorescence intensity before and after adding Ca2+ (5 mM). Data were analyzed by one-way analysis of variance (ANOVA) test; F (3, 8) = 4.163 and F (3, 8) = 6.465 for the base and post Ca2+, respectively. C, Represented images of H9c2 cells, after treated with DHA-S (5 g/L, 25 mM) for 24 h, labeled with Rhod-2 AM and Mito-Tracker Green. Scale bar, 10 µm. D, Quantification of the Rhod-2-positive cells in P1 gate by FACS and the results showed as histograms (down). Data were analyzed by Student’s unpaired T test. All experiments were repeated three times and the data were expressed as mean ± SEM. *, P < 0.05; and * *, P < 0.01; *** , P < 0.001; and *** *, P < 0.0001. |
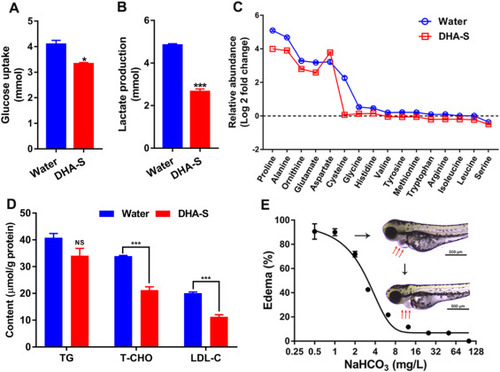
Fig. 4. DHA-S disturbed normal metabolism. A and B, The levels of glucose and lactate in H9c2 cell cultural medium supernatant after 24 h exposure of DHA-S at 1 g/L and compared with raw cultural medium.(n = 3, data are represented as mean ± SEM, *, P < 0.05; and ***, P < 0.001, analyzed by Student’s unpaired T test.) C, the relative abundance of amino acids in H9c2 cell culture supernatant compared with height intensity of internal standard. (n = 4, data are represented as mean.) D, the content of triacylglycerol (TG), total cholesterol (T-CHO) and low-density lipoprotein cholesterol (LDL-C) were examined in zebrafish larvae after 24 h exposure of DHA-S at 50 mg/L. (n = 3, each group containing 50 embryos. Data are represented as mean ± SEM. ***, P < 0.001, analyzed by Student’s unpaired T test.) E, the dose dependent protective effect of sodium bicarbonate on zebrafish from pericardial edema induced by DHA-S (100 mg/L). (n = 3, each group containing 25 embryos) Data are represented as mean ± SEM. Representative pictures of DHA-S induced pericardial edema. Scale bar, 500 µm. |