
- Title
-
A csf1rb mutation uncouples two waves of microglia development in zebrafish
- Authors
- Ferrero, G., Miserocchi, M., Di Ruggiero, E., Wittamer, V.
- Source
- Full text @ Development
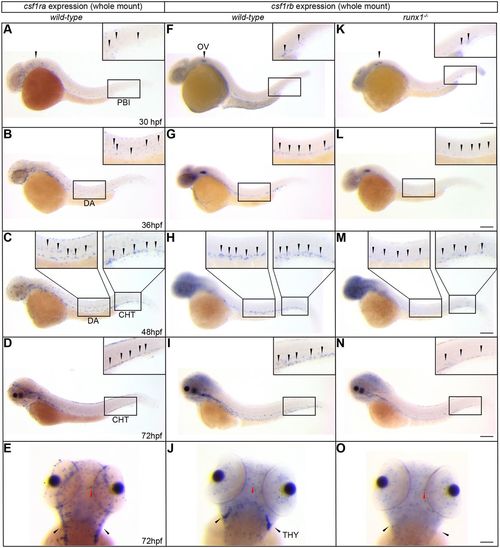
Csf1ra and csf1rb paralogs have non-overlapping distribution during early development, except for microglia. (A-O) WISH expression profiles of csf1ra (A-E) and csf1rb (F-J) in wild-type, and csf1rb in runx1−/− (K-O) embryos, at the indicated stages. All lateral views, except for E, J and O, shown in dorsal view. Black arrowheads indicate cells in each region. Red arrowheads indicate microglia. Insets show magnification of boxed areas. THY, thymus. Scale bars: 200 µm (30 and 36 hpf); 180 µm (48 hpf); 150 µm (72 hpf). EXPRESSION / LABELING:
PHENOTYPE:
|

Characterization of csf1r paralog expression in adult hematopoietic cells. (A) qPCR expression of csf1ra and csf1rb in cd45:DsRed+;mhc2dab:GFP+ mononuclear phagocytes sorted from adult zebrafish organs. Values on the y-axis indicate transcript expression normalized to ef1α expression level. Error bars represent s.e.m. for three experimental replicates. MF, mononuclear phagocytes. (B-E) Expression profiles of csf1r paralogs in adult WKM hematopoietic and non-hematopoietic populations by single-cell RNA-seq analysis, extracted from the public database from Lareau et al. (2017). 2D projection of the t-SNE analysis showing the distinct clusters identified in the adult WKM (B) and profiles of csf1ra (C) and csf1rb (D) expression across the clusters in the t-SNE plot. The intensity of the color is proportional to the level of gene expression. (E) Raw-scaled heatmap showing the relative expression of each csf1r paralog among the different cell clusters. EXPRESSION / LABELING:
|
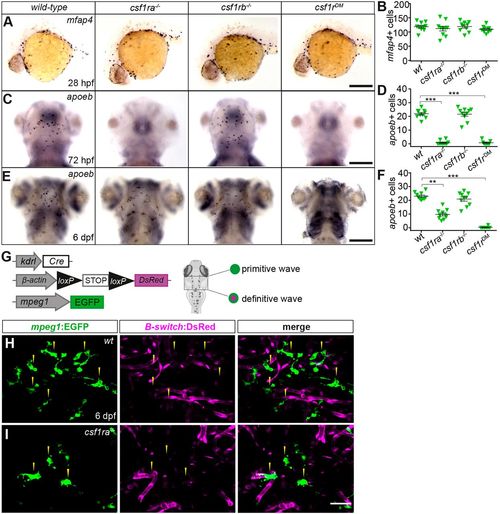
csf1ra and csf1rb are differently required for embryonic microglia development. (A,C,E) WISH of the indicated genes in wild-type (n=10), csf1ra−/− (n=10), csf1rb−/− (n=10) and csf1rDM siblings (24-72 hpf: n=10; 6 dpf: n=7) at the stages indicated. All dorsal views except for A, shown in lateral view. (B,D,F) Quantification of mfap4+ primitive macrophages (B), apoeb+ microglia at 3 dpf (D) and at 6 dpf (F) in the indicated genotypes. Each symbol represents a single embryo/larva and data are mean±s.e.m. Differences between groups were analyzed by Kruskal–Wallis test with post hoc Dunn's multiple comparisons [H=3.56 (B); H=29.72 (D); H=30.11 (F)]. **P<0.005, ***P<0.0005. (G) Scheme of the transgenic lines used to discriminate the primitive and definitive microglia waves in 6 dpf larvae. (H,I) Imaging by confocal microscopy of the optic tectum in 6 dpf wild-type (H) and csf1ra−/− (I) sibling larvae carrying the kdrl:Cre; ßactin:Switch-DsRed; mpeg1:EGFP triple transgene. GFP (left panels), DsRed (middle panels) and merge of both fluorescence channels (right panels) are shown (n=4). Yellow arrowheads indicate mpeg1:EGFP+ microglia. Scale bars: 150 µm (A,C); 100 µm (E); 50 µm (H,I). |
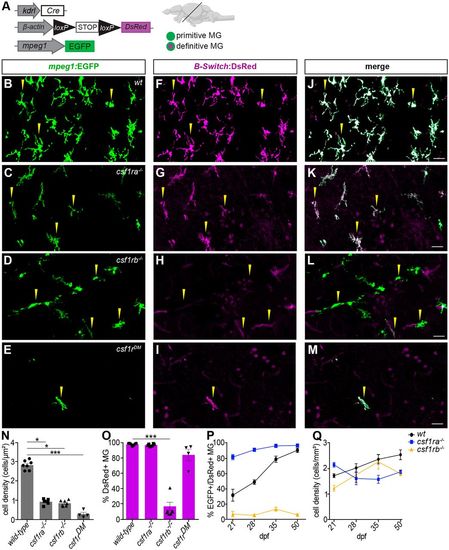
csf1rb is required for HSC-derived microglia development. (A) Scheme of the transgenic lines used to discriminate primitive from definitive microglia in adult zebrafish brains. (B-M) Immunofluorescence on transverse brain sections from Tg(kdrl:Cre; ßactin:Switch-DsRed; mpeg1:EGFP) triple transgenic adult wild-type (B,F,J; n=7), csf1ra−/− (C,G,K; n=6) csf1rb−/− (D,H,L; n=7) and csf1rDM (E,I,M; n=4) fish. GFP (left panels), DsRed (middle panels) and merge of both fluorescence channels (right panels) are shown. (N,O) Quantification of microglia density (GFP+ cells/µm2) (N) and percentage of DsRed+ adult microglia among the whole GFP+ population (O) in each genotype. Each symbol represents a single fish and data are mean±s.e.m. Significances between groups were calculated using the Kruskal–Wallis test with Dunn's post hoc multiple comparisons test [H=19.21 (N); H=19.98 (O)]. *P<0.05, ***P<0.0005. (P,Q) Percentage of GFP+ DsRed+ adult microglia (P) and microglia density (cells/mm3) (Q) at 21, 28, 35 and 50 dpf for each genotype. Each point represents mean±s.e.m. (n=5 individual fish). MG, microglia. Scale bars: 50 µm. PHENOTYPE:
|
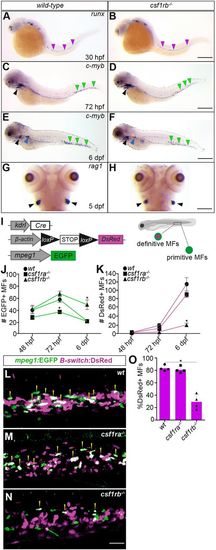
Loss of csf1rb function impairs the development of definitive macrophages. (A-H) WISH of the indicated genes in wild-type and csf1rb−/− siblings at different time points. All lateral views except for G and H, shown in dorsal. The purple arrowheads indicate runx1+ HSCs along the dorsal aorta. The green and blue arrowheads show c-myb+ hematopoietic progenitors in the CHT and in the pronephros, respectively. Black arrowheads indicate rag1+ or c-myb+ lymphoid progenitors in the thymus. (I-P) Confocal imaging analysis of definitive myelopoiesis in csf1r mutant embryos and larvae. (I) Scheme of the transgenic lines used to discriminate the primitive and definitive myelopoiesis waves in the CHT. (J,K) Quantification of GFP+ DsRed− primitive (J) and GFP+ DsRed+ definitive macrophages (K) in wild-type (n=4), csf1ra−/− (n=4) and csf1rb−/− (n=4) embryos carrying the kdrl:Cre; ßactin:Switch-DsRed; mpeg1:EGFP triple transgene, at the indicated developmental stages. Each point represents the mean±s.e.m. of four individuals. (L-O) Confocal imaging (L-N) and quantification, determined as percentage of the whole GFP+ microglia population (O) of GFP+ DsRed+ definitive macrophages (yellow arrowheads) in the CHT of 6 dpf wild-type and csf1r mutant larvae. Each dot plot represents an independent larva. Significances between groups were calculated using the Kruskal–Wallis test with post hoc Dunn's multiple comparisons [H=8.8 (J); H=7.44 (K); H=7.73 (O)]. *P<0.05. MFs, mononuclear phagocytes. Scale bars: 200 µm (A,B); 150 µm (C,D,G,H); 100 µm (E,F); 50 µm (L-N). |
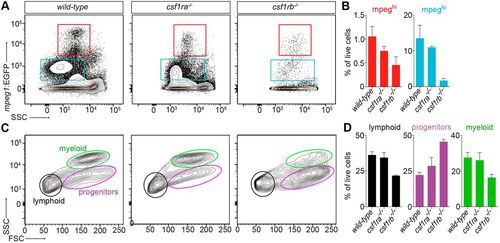
Adult zebrafish csf1rb mutant display hematopoietic deficiencies. (A,B) Flow cytometry analysis of WKM cell suspensions from wild-type, csf1ra−/− and csf1rb−/− adult fish carrying the mpeg1:EGFP reporter. (A) The mpeg1:EGFPhi fractions identify mature macrophages (red frames), whereas the mpeg1:EGFP lo fractions contain mainly IgM-expressing B lymphocytes (blue frames) (Ferrero et al., 2020). (B) Percentage of mpeg1hi and mpeg1lo cells for each genotype, relative to the whole living WKM population. Each bar represents the mean±s.e.m. for three individuals. (C) Scatter profiles of WKM in typical wild-type (left panel), csf1ra−/− (middle panel) and csf1rb−/− (right panel) adult fish. (D) Percentage of cells in the lymphoid (black), myeloid (green) and progenitor (purple) fractions, relative to the whole hematopoietic cell population. Each bar represents the mean±s.e.m. for three individuals. PHENOTYPE:
|

Unillustrated author statements PHENOTYPE:
|