
|
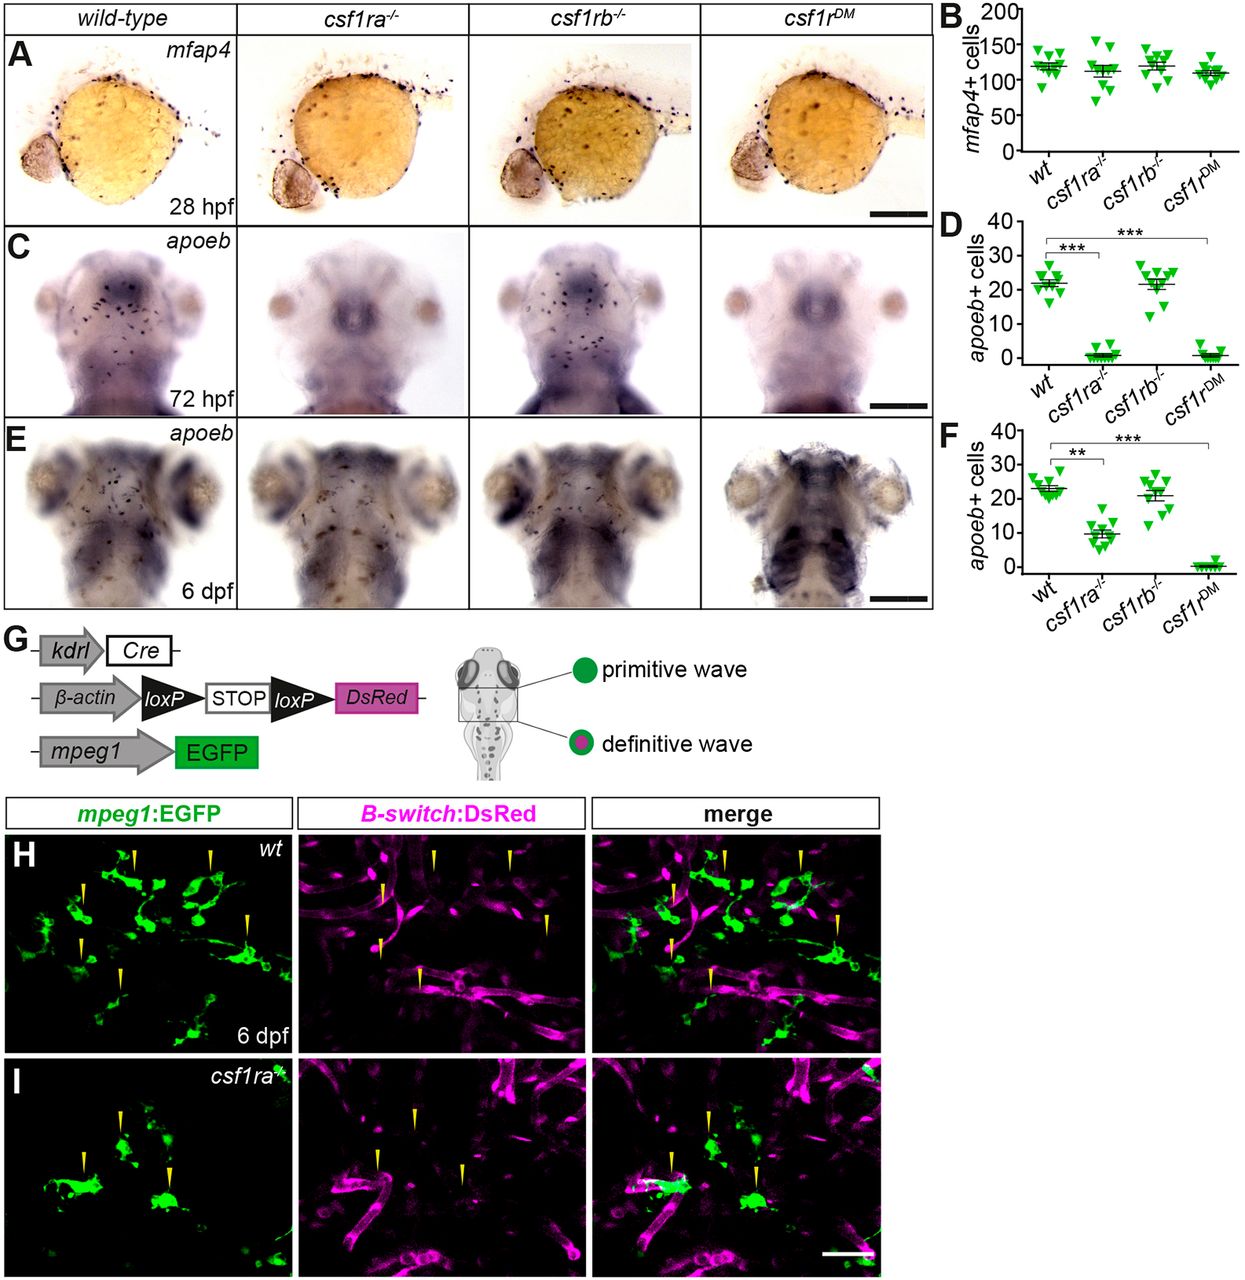
Fig. 3 csf1ra and csf1rb are differently required for embryonic microglia development. (A,C,E) WISH of the indicated genes in wild-type (n=10), csf1ra−/− (n=10), csf1rb−/− (n=10) and csf1rDM siblings (24-72 hpf: n=10; 6 dpf: n=7) at the stages indicated. All dorsal views except for A, shown in lateral view. (B,D,F) Quantification of mfap4+ primitive macrophages (B), apoeb+ microglia at 3 dpf (D) and at 6 dpf (F) in the indicated genotypes. Each symbol represents a single embryo/larva and data are mean±s.e.m. Differences between groups were analyzed by Kruskal–Wallis test with post hoc Dunn's multiple comparisons [H=3.56 (B); H=29.72 (D); H=30.11 (F)]. **P<0.005, ***P<0.0005. (G) Scheme of the transgenic lines used to discriminate the primitive and definitive microglia waves in 6 dpf larvae. (H,I) Imaging by confocal microscopy of the optic tectum in 6 dpf wild-type (H) and csf1ra−/− (I) sibling larvae carrying the kdrl:Cre; ßactin:Switch-DsRed; mpeg1:EGFP triple transgene. GFP (left panels), DsRed (middle panels) and merge of both fluorescence channels (right panels) are shown (n=4). Yellow arrowheads indicate mpeg1:EGFP+ microglia. Scale bars: 150 µm (A,C); 100 µm (E); 50 µm (H,I).