
- Title
-
Type I interferon-dependent response of zebrafish larvae during tilapia lake virus (TiLV) infection
- Authors
- Widziolek, M., Janik, K., Mojzesz, M., Pooranachandran, N., Adamek, M., Pecio, A., Surachetpong, W., Levraud, J.P., Boudinot, P., Chadzinska, M., Rakus, K.
- Source
- Full text @ Dev. Comp. Immunol.
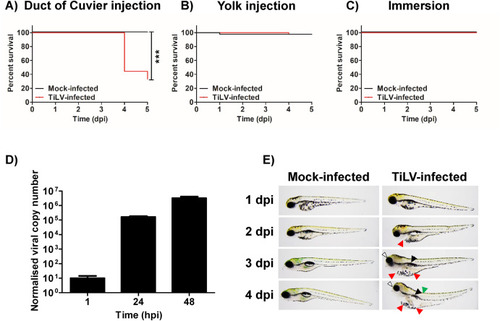
Fig. 1. Zebrafish larvae are susceptible to TiLV in a systemic infection model. Survival of zebrafish larvae infected with TiLV or mock-infected (2.5 dpf) by the injection into the duct of Cuvier (A) or into the yolk (B) or infected by immersion (C). N = 20 larvae in duplicate per group per experiment. Comparisons between survival curves were made using the log-rank test. Normalized copy numbers of TiLV RNA in 5 pooled larvae of zebrafish injected with TiLV into the duct of Cuvier at 2.5 dpf (D). Data were normalized against mRNA transcript of ef1a gene of the host. Each bar represents the mean + SD of n = 4 samples. Morphology of zebrafish larvae infected with TiLV or mock-infected by the injection (2.5 dpf) into the duct of Cuvier (E). The arrows indicate morphological abnormalities in TiLV-infected larvae (white - eye abnormalities; red - yolk sac & pericardium oedema; black - swim bladder; green - spine curving). The data in Fig. 1A, B, C, D and E are representative of two independent experiments. (For interpretation of the references to colour in this figure legend, the reader is referred to the Web version of this article.) |
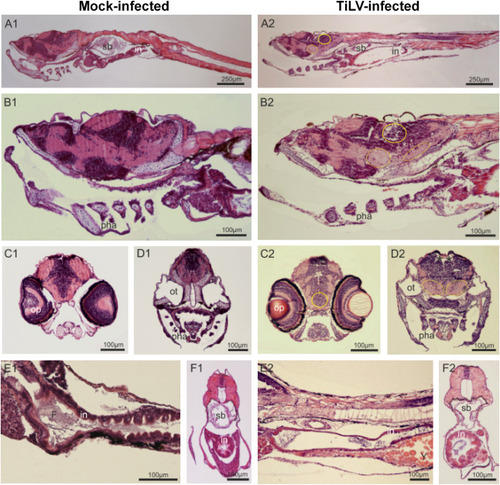
Fig. 2. TiLV-induced histopathological abnormalities in zebrafish larvae. Parasagittal and cross paraffin sections from mock-infected (A1-F1) and TiLV-infected (A2-F2) zebrafish at 4 dpi, stained with H&E. Anterior to the left, dorsal top. N = 6 specimens per each group. In the larvae of TiLV-infected group, all regions of degenerative tissues are encircled in the region of nerve cells bodies and by a dotted oval in the neuropils, where alveolar space is visible. A1-A2: Sagittal section trough larvae till the middle part of the tail (in – intestine; sb – swim bladder). B1–B2: braincase, mouth, gill chamber with pharyngeal arch and gill filaments (pha), anterior part of the digestive tract and liver. C1–C2 and D1-D2: Cross sections of the head on an optic (op) and otic (ot) level. (*) indicates increased blood vessels. E1-E2 and F1–F2: Longitudinal sections through the gastrointestinal region; In mock-infected group intestine epithelium (in) is folded and in the lumen the digested food (F) is present, whereas in TiLV-infected group a delay in gut development is observed with yolk (Y) still present at 6 dpf and minimal folding of intestinal epithelium of some specimens. |
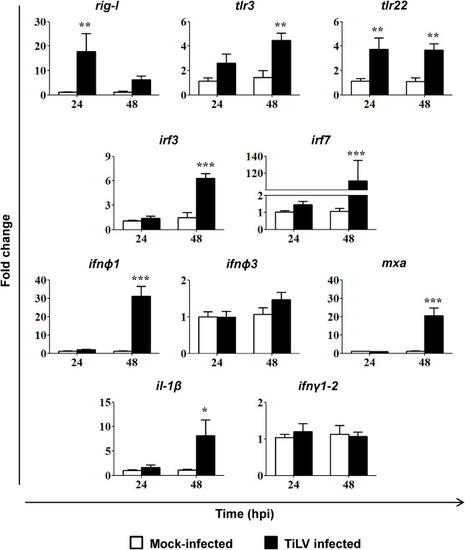
Fig. 3. TiLV-induced changes in the expression of genes involved in antiviral response. Gene expression of the pathogen recognition receptors (rig-I (ddx58), tlr3, tlr22), transcription factors (irf3, irf7), type I interferon (infϕ1, infϕ3), antiviral protein (mxa) and pro-inflammatory cytokines (il-1β, ifnγ1-2) in 5 pooled larvae of zebrafish mock-infected or TiLV-infected by injection into the duct of Cuvier at 2.5 dpf. The gene expression is normalized against the housekeeping gene rps11. Changes in gene expression of TiLV-infected larvae (black bars) are shown as x-fold increase compared to mock-infected control larvae (white bars) at each time point. The symbol (*) indicates significant differences between the mock-infected and TiLV infected larvae at each time point (*p ≤ 0.05; **p ≤ 0.01; ***p ≤ 0.001) as revealed by two-way ANOVA followed by a Bonferroni test. Each bar represents the mean + SD of n = 7–8 samples derived from two independent experiments. |
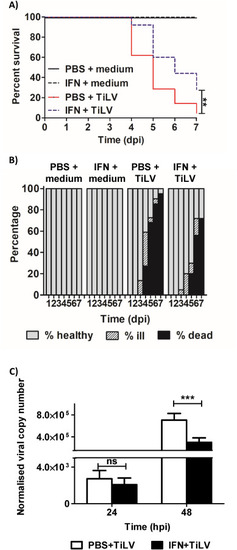
Fig. 4. Recombinant zfIFNϕ1 decreases mortality, morbidity and viral load in TiLV-infected zebrafish larvae. Survival of zebrafish larvae (A). Larvae were injected with 1 ng of recombinant zfIFNϕ1 or PBS (final vol. of 1 nl) into the duct of Cuvier at 2.5 dpf. 6 h post-stimulation larvae were mock-infected or TiLV-infected by injection into the duct of Cuvier. Comparisons between survival curves were made using the log-rank test. Percentage of dead, ill or healthy larvae pre-treated with zfINFϕ1or PBS 6h before mock or TiLV infection (B). The procedure was the same as for Fig. 4A. The data in Fig. 4A and B are representative of two independent experiments. Normalized copy numbers of TiLV RNA in 5 pooled larvae of zebrafish injected with PBS (white bars) or recombinant zfIFNϕ1 (black bars) into the duct of Cuvier at 2.5 dpf (C). Larvae were infected with TiLV by injection into the duct of Cuvier 6 h post-stimulation. Data are normalized against mRNA transcript of ef1a gene of the host. The symbol (*) indicates significant differences between the non-stimulated control larvae and zfIFN1 stimulated larvae at each time point (*p ≤ 0.05; **p ≤ 0.01; ***p ≤ 0.001) as revealed by two-way ANOVA followed by a Bonferroni test. Each bar represents the mean + SD of n = 9–10 samples derived from two independent experiments. |
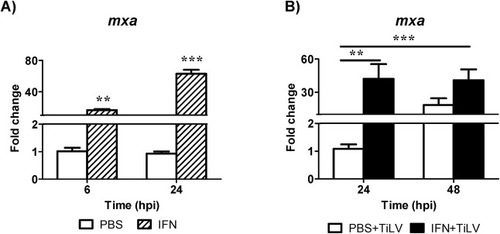
Fig. 5. Recombinant zfIFNϕ1-induced changes in the expression of mxa gene. The mxa gene expression is normalized against the housekeeping gene rps11. Changes in mxa expression in 5 pooled larvae of zebrafish injected with recombinant zfIFN1 at 2.5 dpf (striped bars) are shown as x-fold increase compared to PBS injected control larvae (white bars) in each time point (A). The symbol (*) indicates significant differences between the zfIFNϕ1 stimulated and non-stimulated larvae at each time point (*p ≤ 0.05; **p ≤ 0.01; ***p ≤ 0.001) as revealed by two-way ANOVA followed by a Bonferroni test. Each bar represents the mean + SD of n = 6 samples. Changes in mxa expression in 5 pooled larvae of zebrafish injected with PBS (white bars) or recombinant zfIFNϕ1 (black bars) into the duct of Cuvier at 2.5 dpf (B). Larvae were infected with TiLV by injection into the duct of Cuvier 6 h post zfIFNϕ1 or PBS treatment. The symbol (*) indicates significant differences between the zfIFNϕ1 treated (24 and 48 hpi) or PBS treated (48 hpi) larvae and PBS treated larvae at 24 hpi (*p ≤ 0.05; **p ≤ 0.01; ***p ≤ 0.001) as revealed by one-way ANOVA followed by Dunnett multiple comparison test. Each bar represents the mean + SD of n = 9–10 samples derived from two independent experiments. |