
- Title
-
Generation and Application of the Zebrafish heg1 Mutant as a Cardiovascular Disease Model
- Authors
- Lu, S., Hu, M., Wang, Z., Liu, H., Kou, Y., Lyu, Z., Tian, J.
- Source
- Full text @ Biomolecules
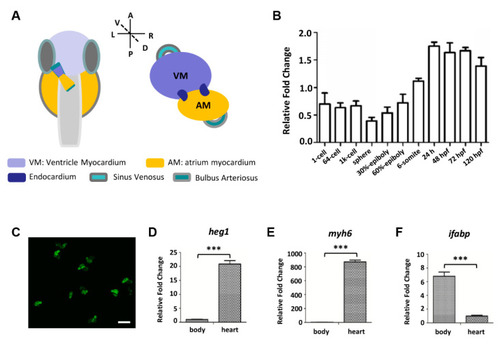
The expression level of |
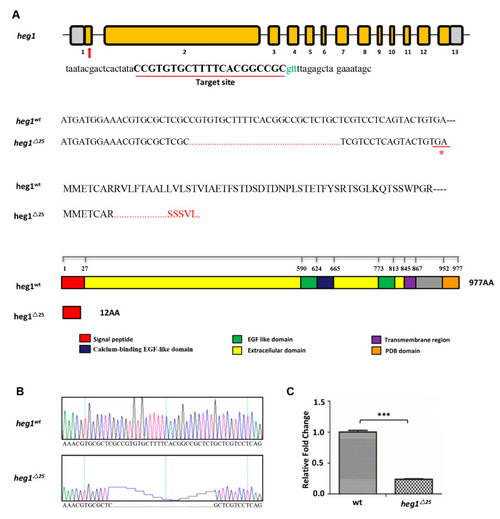
The generation of EXPRESSION / LABELING:
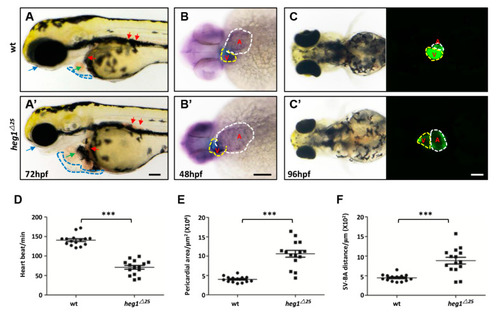
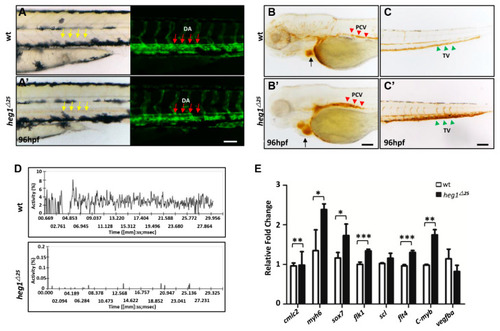
PHENOTYPE:
|
|
|
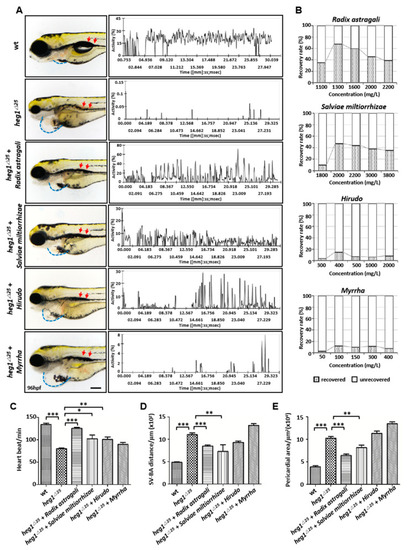
TCM pharmacological validation of |
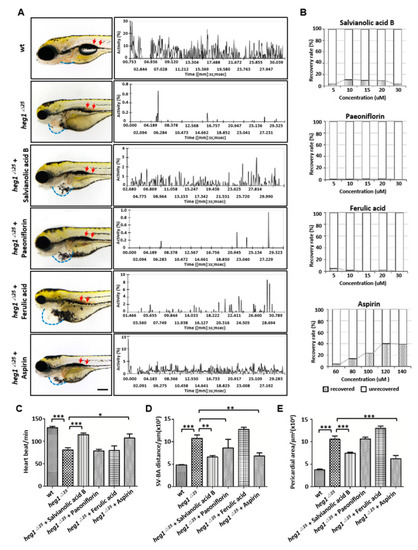
Monomers pharmacological validation of |