IMAGE

Figure 5

ID
ZDB-IMAGE-201130-77
Source
Figures for Lu et al., 2020
Image
Figure Caption

Figure 5

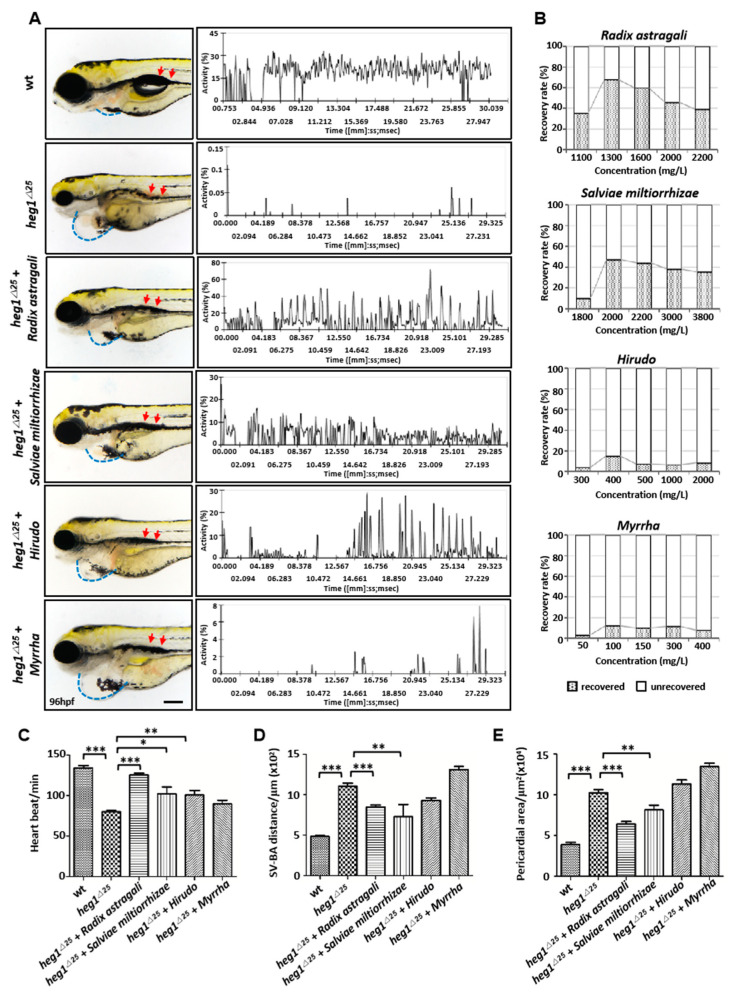
TCM pharmacological validation of heg1∆25 zebrafish mutant. (A) Phenotype observation and the relative movement of RBCs in PVC analysis of heg1∆25 embryos treated with four TCM herbs. (B) The optimal concentrations of the four drugs, as indicated as Radix astragali 1300 mg/L, Salviae miltiorrhiza 2000 mg/L, Hirudo 400 mg/L, and Myrrha 100 mg/L, respectively. N = 40 embryos for each concentrations. (C) Comparison of heart rate of zebrafish embryos in each group. (D) Comparison of SV-BA distance of zebrafish embryos in each group. (E) Comparison of pericardial area of zebrafish embryos in each group. Data are represented as mean ± SE from three independent experiments, * p < 0.05, ** p < 0.01, and *** p < 0.001 (Student’s t-test).

Acknowledgments
This image is the copyrighted work of the attributed author or publisher, and ZFIN has permission only to display this image to its users. Additional permissions should be obtained from the applicable author or publisher of the image. Full text @ Biomolecules