
- Title
-
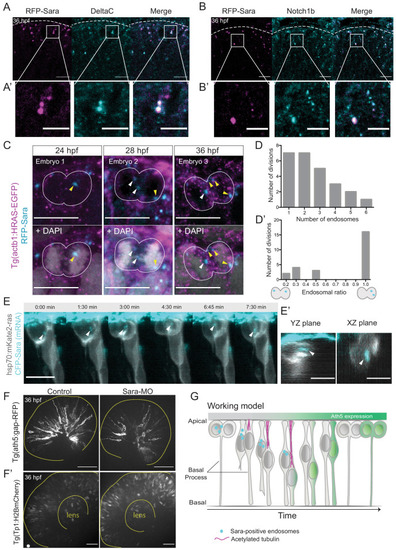
Asymmetric neurogenic commitment of retinal progenitors involves Notch through the endocytic pathway
- Authors
- Nerli, E., Rocha-Martins, M., Norden, C.
- Source
- Full text @ Elife
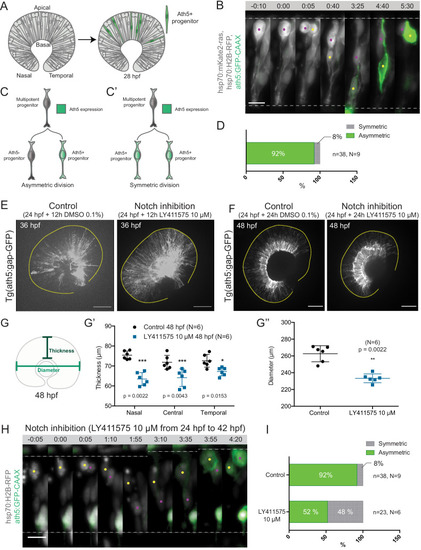
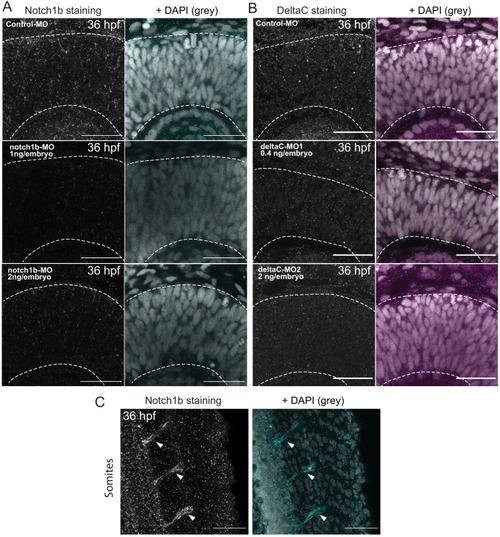
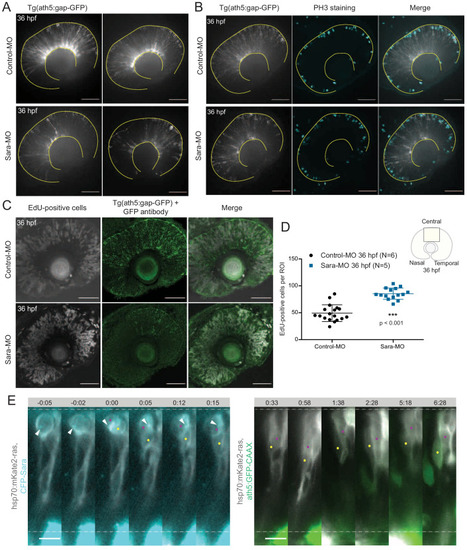
Notch inhibition affects progenitor division patterns. ( |
Notch inhibition affects progenitor division patterns. ( |
( |
( |
( |
( |
( |
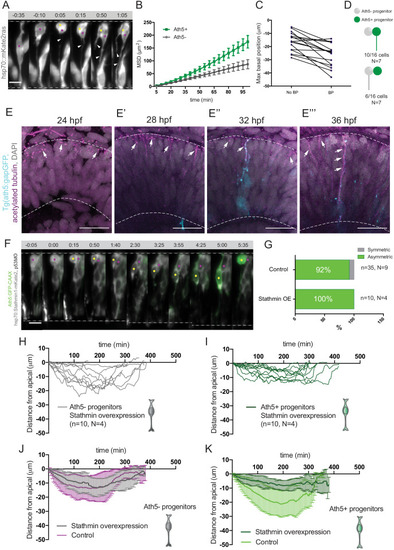
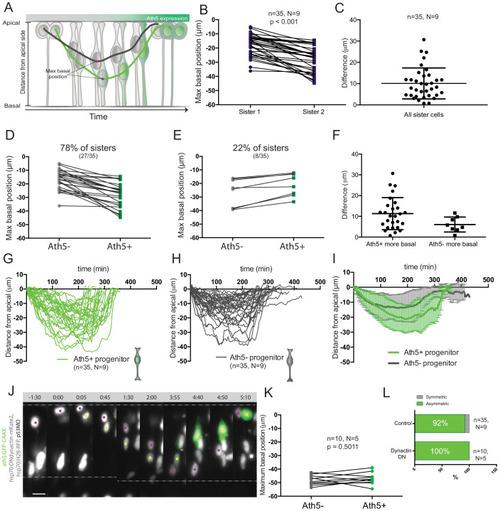
Stathmin is labelled by hsp70:Stathmin1-mKate2 (grey) and Ath5 expression is followed using ath5:GFP-CAAX (green). Time is shown in hours and minutes. Yellow and magenta dots label Ath5+ and Ath5- sister cell, respectively. |
( |
( |