Image
Figure Caption

Figure 1—figure supplement 1. Ath5- sister cells do not enter the Ath5 lineage in the next cell cycle.

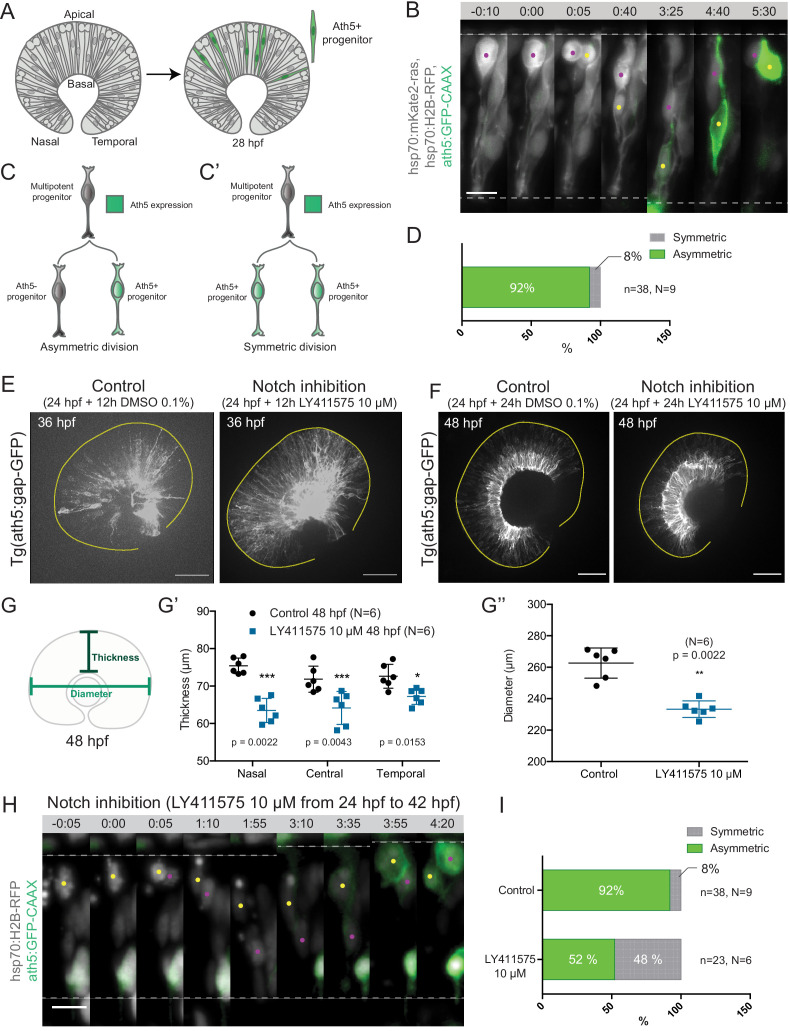
Notch inhibition affects progenitor division patterns. (A) Onset of Ath5 expression (green) in Ath5+ progenitors between divisions. (B) Example of Ath5- sister cell followed to next division. hsp70:H2B-RFP (nuclei, grey), ath5:GFP-CAAX (Ath5, green). Scale bar, 10 μm. (C) Schematics of lineage tree of Ath5- cell. (D) Ath5+ cells (grey) at 36 hpf in control (left) and upon Notch inhibition (right) with DAPT 50 μM. Scale bar, 50 μm. The yellow line delimits the apical side of the retinal neuroepithelium. (E) EdU+ cells (grey) at 42 hpf in control (left) and upon Notch inhibition (right) treated with 10 μM LY411575. Scale bar, 50 μm. The yellow lines delimit the apical and basal side of the retinal neuroepithelium. (F) Quantification of EdU-positive cells in the central portion of the retina in control (black) and upon Notch inhibition (blue). Unpaired t-test with Welch’s correction. Error bars represent standard deviation.

Acknowledgments
This image is the copyrighted work of the attributed author or publisher, and ZFIN has permission only to display this image to its users. Additional permissions should be obtained from the applicable author or publisher of the image. Full text @ Elife