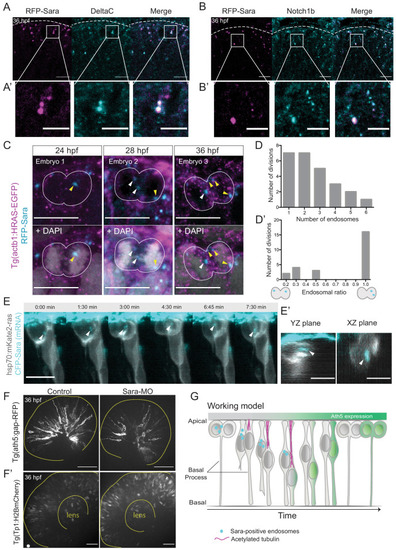
Figure 5—figure supplement 1.

Sara-positive endosomes are asymmetrically distributed during cell division.

(A) Ath5+ cells (grey) in the retinal neuroepithelium at 36 hpf in embryos injected with control-MO (upper row) and 2.5 ng/embryo Sara-MO (lower row). Scale bar, 50 μm. The yellow lines delimit the apical and basal side of the retinal neuroepithelium. (B) pH3 staining (cyan) in 36 hpf Tg(ath5:gap-GFP) embryos (grey) injected with control-MO (upper row) and 2.5 ng/embryo Sara-MO (lower row). Scale bar, 50 μm. The yellow lines delimit the apical side of the retinal neuroepithelium. (C) EdU+ cells (grey) at 36 hpf in control (upper row) and upon Sara knockdown (lower row) in Tg(ath5:gap-GFP) embryos (green). Scale bar, 50 μm. (D) Quantification of EdU-positive cells in the central portion of the retina in control (black) and Sara knockdown (blue). Unpaired t-test with Welch’s correction. Error bars represent standard deviation. (E) Example of an asymmetric inheritance of Sara-positive endosomes (left) within asymmetric division of multipotent progenitors generating Ath5+ progenitors (right). hsp70:mkate2-ras (cells membrane, grey), CFP-Sara (Sara-positive endosomes, cyan), ath5:GFP-CAAX (Ath5, green). Dashed lines show apical and basal sides of the retinal neuroepithelium. Scale bar, 10 μm. Magenta and yellow dots label sister cells. White arrow points to the Sara-positive endosome.

Expression Data

Expression Detail
Antibody Labeling
Phenotype Data

Phenotype Detail
Acknowledgments
This image is the copyrighted work of the attributed author or publisher, and ZFIN has permission only to display this image to its users. Additional permissions should be obtained from the applicable author or publisher of the image. Full text @ Elife