
- Title
-
Primary and secondary motoneurons use different calcium channel types to control escape and swimming behaviors in zebrafish
- Authors
- Wen, H., Eckenstein, K., Weihrauch, V., Stigloher, C., Brehm, P.
- Source
- Full text @ Proc. Natl. Acad. Sci. USA

CaP 1°Mn occupies nearly all of the synapses formed on individual muscle cells. (A) Maximal projection of confocal images of a CaP (red) and an example target muscle with its associated receptor clusters (green). The CaP was labeled with tdTomato expression driven by the mnx1 promoter. Postsynaptic receptors were labeled with rapsyn-GFP driven by the α-actin promoter that sparsely labeled muscle cells. (B) Confocal Z-stack maximal projection (Top) and single focal plane (Bottom) images of approximately two segments showing colocalization of AChR labeling with α-Btx (red) and rapsyn-GCaMP6f basal fluorescence (green). (Scale bars, 20 μm.) (C) Example GCaMP6f fluorescence responses for five synapses in response to 0.2-Hz stimulation of the CaP (10 consecutive responses are shown). In this focal plane, ROIs 1 to 4 are located in the same muscle cell, while ROI 5 is on a different muscle. Scale bars, 15 μm. (D) Individual GCaMP6f responses for the five ROIs in response to 0.2-Hz stimulation of the CaP. (E) Overall distribution of Pr at 0.2 Hz measured for 59 ROIs from 16 fish. |
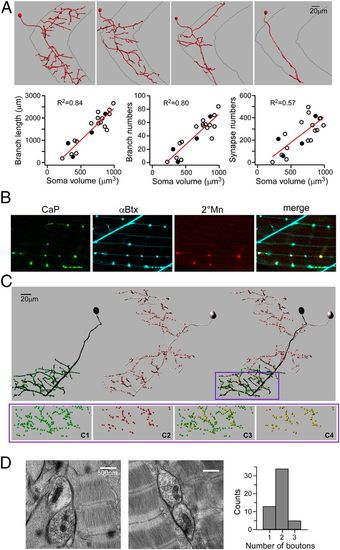
Sharing of synapses by 1° and 2°Mns. (A) Imaris reconstructions of four different 2°Mns exemplifying the range of axonal branching patterns (Top). Relationships between soma volume versus axonal branch length, branch number, and α-Btx punctum number are shown (Bottom). Each symbol represents a reconstruction of an individual 2°Mn, with filled symbols corresponding to the four examples shown. The relationship shows a linear fit with R2 values indicated. (B) Confocal images showing colocalization of fluorescently labeled CaP terminals (green), postsynaptic AChR (cyan), 2°Mn terminals (red), and merge. CaP is labeled with EGFP expression driven by the SAIG213A Gal4 promoter. A single 2°Mn is labeled with tdTomato expression driven by the mnx1 promoter. (C) Imaris reconstruction of a 1°Mn (black) and a 2°Mn (gray). Individual synapses, based on the α-Btx label, are color-coded in green (for 1°Mn), red (for 2°Mn), and yellow (scored as shared). Only the bottom half of the ventral muscle field is considered for quantitation as CaP is the sole 1°Mn innervating that area. (C, Bottom) An expanded view of the boxed region shows the distribution of synapses that are associated with CaP (C1) or 2°Mn (C2) or scored as shared among all synapses (C3) or in relation to the 2°Mn synapses (C4). In this example, 98% of the labeled 2°Mn synapses in the overlapping region were shared with the CaP. (D) Example electron micrographs showing two boutons sharing a synapse. (D, Right) Histogram of 52 images from six fish is shown. |