
|
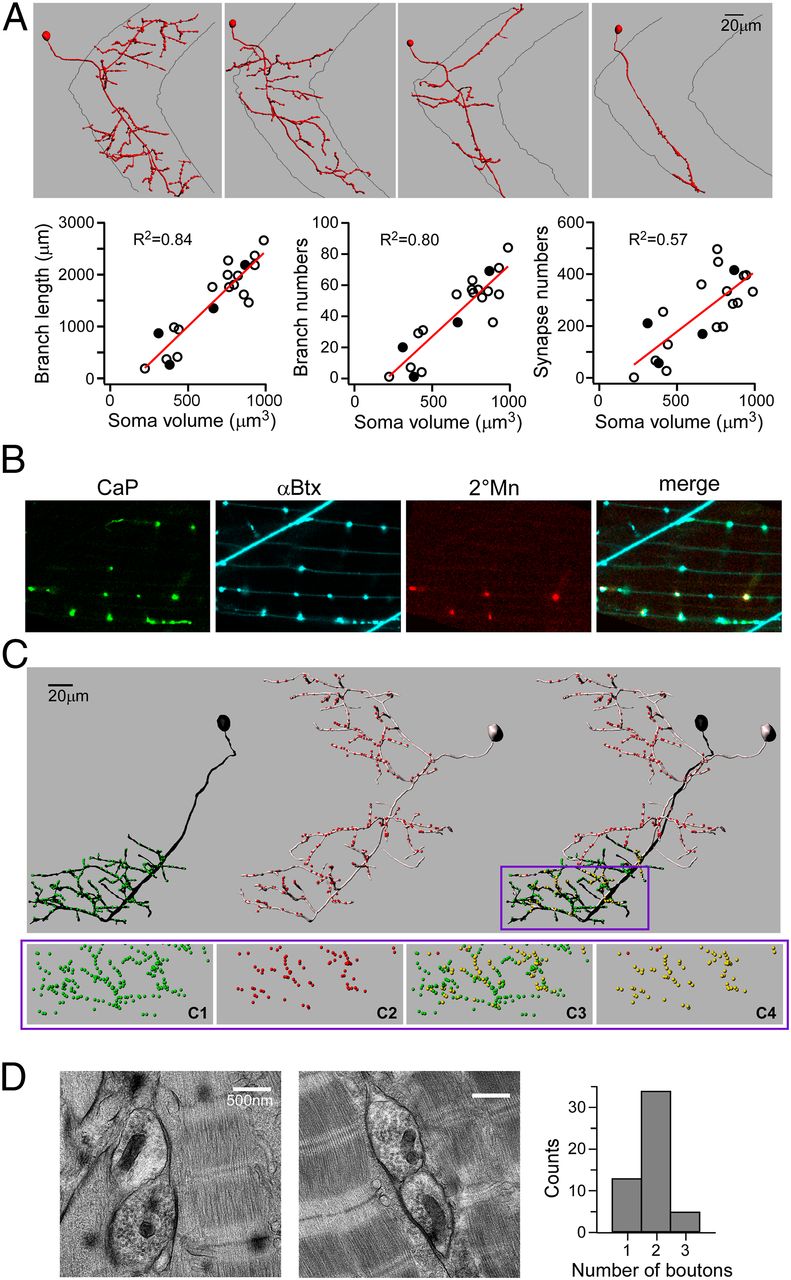
Fig. 2 Sharing of synapses by 1° and 2°Mns. (A) Imaris reconstructions of four different 2°Mns exemplifying the range of axonal branching patterns (Top). Relationships between soma volume versus axonal branch length, branch number, and α-Btx punctum number are shown (Bottom). Each symbol represents a reconstruction of an individual 2°Mn, with filled symbols corresponding to the four examples shown. The relationship shows a linear fit with R2 values indicated. (B) Confocal images showing colocalization of fluorescently labeled CaP terminals (green), postsynaptic AChR (cyan), 2°Mn terminals (red), and merge. CaP is labeled with EGFP expression driven by the SAIG213A Gal4 promoter. A single 2°Mn is labeled with tdTomato expression driven by the mnx1 promoter. (C) Imaris reconstruction of a 1°Mn (black) and a 2°Mn (gray). Individual synapses, based on the α-Btx label, are color-coded in green (for 1°Mn), red (for 2°Mn), and yellow (scored as shared). Only the bottom half of the ventral muscle field is considered for quantitation as CaP is the sole 1°Mn innervating that area. (C, Bottom) An expanded view of the boxed region shows the distribution of synapses that are associated with CaP (C1) or 2°Mn (C2) or scored as shared among all synapses (C3) or in relation to the 2°Mn synapses (C4). In this example, 98% of the labeled 2°Mn synapses in the overlapping region were shared with the CaP. (D) Example electron micrographs showing two boutons sharing a synapse. (D, Right) Histogram of 52 images from six fish is shown.