
- Title
-
Hypothalamic Dopamine Neurons Control Sensorimotor Behavior by Modulating Brainstem Premotor Nuclei in Zebrafish
- Authors
- Barrios, J.P., Wang, W.C., England, R., Reifenberg, E., Douglass, A.D.
- Source
- Full text @ Curr. Biol.
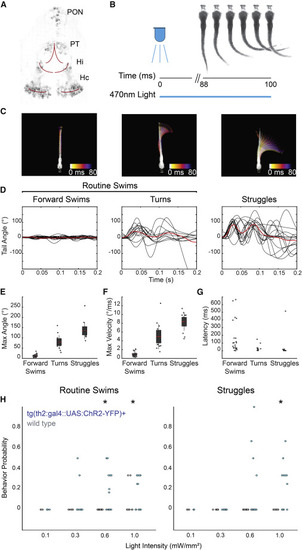
Figure 1. Stimulation of th2+ Neurons Drives Locomotor Behavior (A) Two-photon fluorescence image of transgene expression in a Tg(th2:gfp-aequorin) animal. Expression is found in four anatomical clusters: the preoptic nucleus (PON), posterior tuberculum (PT), intermediate hypothalamus (Hi), and caudal hypothalamus (Hc). Red lines indicate approximate position of ventricles. (B) Experimental schematic. Eyeless fish were exposed to 100-ms pulses of 470-nm light at varying intensities, while the tail was imaged at 500 Hz. (C) Example behavior types evoked by stimulation of th2+ neurons and automatically classified by SOM clustering of kinematic parameters. Examples are shown in Video S1. Maximum intensity projections over the first 80 ms are shown; color represents time. (D) Tail angle traces of forward swims, turns, and struggle behaviors from all fish (n = 12 fish). Red trace, mean. (E–G) Max angle, max velocity, and latency of forward swims, turns, and struggles. Dots represent single trials; red bar, mean; gray boxes, 95% confidence intervals (CIs); gray lines, standard deviation. (H) Probability of evoked routine swims and c-bends following optogenetic stimulation in fish expressing chr2-yfp under the th2 promoter as well as wild-type sibling controls. Bonferroni-corrected Kruskal-Wallis test; n = 12 fish; p < 0.01; dots represent single animals. |
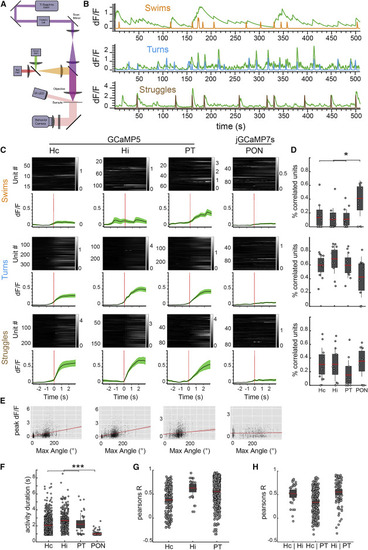
Figure 2. th2+ Neuron Activity Is Highly Correlated with Spontaneous Behavior (A) Experimental setup. Behavior recording was accomplished using a ring of oblique 830-nm LEDs mounted to the fluorescence objective. Fish behavior was recorded with a high-speed camera below the stage at 500 Hz. (B) Examples of forward swim, turn, and struggle regressors (orange, blue, and brown) and significantly correlated calcium traces (green). (C) Calcium traces aligned to spontaneous behavior onset, separated by anatomical nucleus and behavior type. Gray traces show the behavior-triggered average for individual units (mean dF/F). Green traces are mean ± SEM across animals (n = 20 fish). Activity in Hc, Hi, and PT neurons was recorded using Tg(th2:gcamp5); activity in PON was recorded using transient expressors of th2:jgcamp7s. Example recording is shown in Video S2. (D) Percentage of units in each nucleus significantly correlated with swim (top), turn (middle), and struggle (bottom) regressors. Red bar indicates the mean; gray boxes, 95% CI; gray lines, SD; ∗p < 0.05, Bonferroni-corrected ANOVA (n = 20 fish). (E) Scatterplot of the maximum tail bend angle of individual bouts versus the peak calcium signal of th2+ neurons in each nucleus within 1 s of the behavior. Red line, fitted regression. From left to right: n = 3,833, 3,883, 3,152, and 1,797 behaviors; Pearson’s R = 0.38, 0.35, 0.12, and 0.05. (F) Average length of significant calcium transients from cells in each nucleus of Tg(th2:gcamp5) animals. Bonferroni-corrected ANOVA; n = 1,154 cells; p < 0.001. (G) Pearson’s R values between units within individual nuclei. Dots represent single neuron pairs. n = 200, 28, and 414 pairs. (H) Pearson’s R values between units in different nuclei. Dots represent single neuron pairs. n = 31, 263, and 89 pairs. |
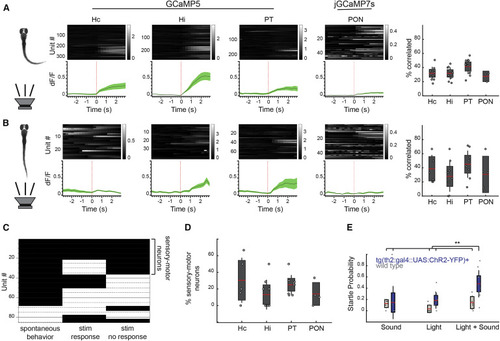
Figure 3. th2+ Neurons Dynamically Modulate Audiomotor Sensitivity (A) Calcium traces aligned to audiomotor stimuli that resulted in a behavioral response, separated by anatomical nucleus. Gray traces show the behavior-triggered average for individual units (mean dF/F). Green traces are mean ± SEM. Right: percent of each cluster significantly correlated with regressors encoding stimuli evoking a behavior. Pearson’s regression, alpha = 0.05. Dots represent single fish; red bar, mean; gray boxes, 95% CIs; gray lines, standard deviation. From left to right, n = 11, 11, 11, and 3 fish. (B) Calcium traces aligned to audiomotor stimuli that failed to evoke a behavioral response, separated by anatomical nucleus. Gray traces show the behavior-triggered average for individual units (mean dF/F). Green traces are mean ± SEM. Right: percent of each cluster significantly correlated with regressors encoding stimuli not evoking a behavior. Pearson’s regression, alpha = 0.05. Dots represent single fish; red bar, mean; gray boxes, 95% CIs; gray lines, standard deviation. From left to right, n = 5, 8, 9, and 4 fish. (C) Barcode showing significant (black; p < 0.05) and non-significant (white; p > 0.05) regression results for individual units (n = 86 neurons, 8 fish). (D) Percent of each cluster significantly correlated to both acoustic stimulation not evoking a behavioral response and spontaneous motor behavior. Dots represent single fish; red bar, mean; gray boxes, 95% CIs; gray lines, standard deviation. From left to right, n = 5, 8, 9, and 4 fish. (E) Probability of evoked startle behavior following audiomotor and optogenetic stimulation in fish expressing chr2-eyfp under the th2 promoter as well as wild-type sibling controls. n = 5 wild type and 11 chr2+; Bonferroni-corrected ANOVA; p < 0.005. |

Figure 4. Mosaic Labeling of th2+ Neurons Reveals Long-Range Projections from the PON and Reciprocal Connectivity between Hc, Hi, and PT (A) Experimental workflow. Fish were injected at the one-cell stage with a low concentration of the th2:gfp-aequorin plasmid to achieve sparse labeling. At 6 dpf, fish were fixed and stained for GFP and total ERK. Confocal stacks were transformed for registration to the z-brain atlas using the total ERK channel, and the same transformation was then applied to the GFP channel. Neurons were manually traced, and the anatomical locations of the soma and axonal termini were identified using the z-brain viewer in MATLAB [37]. Cyan boundaries mark annotated brain regions from the z-brain reference atlas. (B–E) Maximum intensity projection of confocal stacks showing th2+ neurons (green) in Hc (B), Hi (C), PT (D), and PON (E) morphologically registered to the z-brain reference atlas (magenta). IO, inferior olive; nMLF, nucleus of the medial longitudinal fasciculus; TS, torus semicircularis. (F and G) Example ascending (F) and locally projecting (G) th2+ neurons in Hc. (H and I) Example ascending (H) and locally projecting (I) th2+ neurons in Hi. (J and K) Example descending (J) and locally projecting (K) th2+ neurons in PT. (L–O) Example th2+ neurons in PON. All scale bars, 20 μm. |
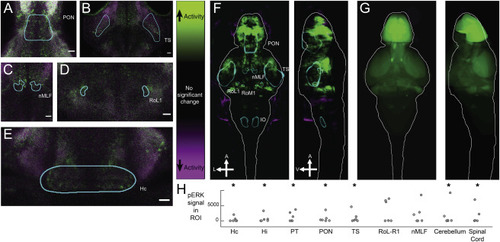
Figure 5. Whole-Brain Activity Mapping Confirms the Functional Significance of Anatomically Defined Target Regions (A) Z section showing activated neurons in the PON following optogenetic stimulation in a Tg(th2:GAL4; uas:chr2-eyfp)+ fish. Magenta, tERK; green, pERK. (B) Z section showing activated neurons in the torus semicircularis following optogenetic stimulation in a Tg(th2:GAL4; uas:chr2-eyfp)+ fish. Magenta, tERK; green, pERK. (C) Z section showing activated neurons in the nMLF following optogenetic stimulation in a Tg(th2:GAL4; uas:chr2-eyfp)+ fish. Magenta, tERK; green, pERK. (D) Z section showing activated neurons in RoL-R1 following optogenetic stimulation in a Tg(th2:GAL4; uas:chr2-eyfp)+ fish. Magenta, tERK; green, pERK. (E) Z section showing activated neurons in Hc following optogenetic stimulation in a Tg(th2:GAL4; uas:chr2-eyfp)+ fish. Magenta, tERK; green, pERK. (F) Mean projection of significant, voxelwise Mann-Whitney U-statistic Z scores of an example MAP-mapping experiment. Green regions indicate increased activity following stimulation of th2+ neurons; purple regions indicate decreased activity (n = 15 fish per condition). (G) Mean projection of z-brain annotated regions showing average signal in each annotated anatomical region of the z-brain for the experiment in (F). (H) Quantified pERK ratio in regions of interest (ROIs) showing significantly increased pERK signal after stimulation of th2+ neurons. Dots are experimental replicates. Stars indicate p < 0.05; n = 6 experiments; one-tailed Wilcoxon rank sum test. |

Figure 6. th2-Expressing Dopamine Neurons Drive Locomotion by Activating Spinal Projection Neurons in the Mid- and Hindbrain (A) Schematics of the experimental preparation for simultaneous calcium imaging of spinal projection neurons (SPNs) and motor nerve (MN) recordings. SPNs are labeled by backfilling from the spinal cord with the dextran conjugated calcium sensitive dye Cal-590. The red box highlights the brain region expanded in (B). (B) Left: maximum intensity projection image of SPNs in the midbrain and hindbrain. Right: cell bodies of imaged SPNs are outlined. VSN, vestibulospinal neuron. (C) Normalized calcium fluorescence change versus time for identified SPNs shown in (B) during optogenetic stimulation in Tg(th2:GAL4; uas:chr2-eyfp) fish. Uniquely colored traces indicate different neurons within each class. The bottom black trace represents the motor nerve recording; the blue box indicates the photoactivating stimulus, also apparent in the artifactual increase in fluorescence signal for each cell. (D) Whole-cell current clamp recording from a representative nMLF neuron, MeLr, during optogenetic stimulation of th2-expressing neurons with simultaneous motor nerve recording. (D’) An expanded view of the shaded area in the lower panel is shown. (E) Boxplot showing the latency from the photoactivating stimulus onset to the first MeLr action potential. n = 4 fish, 12 trials. (F) Boxplot showing mean firing frequencies of the MeLr in the 500-ms time windows before, during, and immediately after photoactivating stimulation. n = 4 fish, 12 trials. (G) Boxplot showing the latency from the first MeLr action potential to the onset of motor nerve activity. n = 4 fish, 11 trials. |