
Fig. 3
- ID
- ZDB-FIG-210208-3
- Publication
- Barrios et al., 2020 - Hypothalamic Dopamine Neurons Control Sensorimotor Behavior by Modulating Brainstem Premotor Nuclei in Zebrafish
- Other Figures
- All Figure Page
- Back to All Figure Page
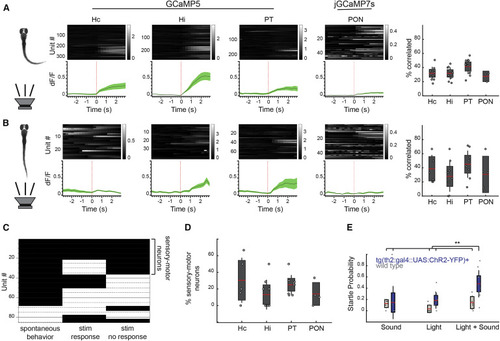
Figure 3. th2+ Neurons Dynamically Modulate Audiomotor Sensitivity (A) Calcium traces aligned to audiomotor stimuli that resulted in a behavioral response, separated by anatomical nucleus. Gray traces show the behavior-triggered average for individual units (mean dF/F). Green traces are mean ± SEM. Right: percent of each cluster significantly correlated with regressors encoding stimuli evoking a behavior. Pearson’s regression, alpha = 0.05. Dots represent single fish; red bar, mean; gray boxes, 95% CIs; gray lines, standard deviation. From left to right, n = 11, 11, 11, and 3 fish. (B) Calcium traces aligned to audiomotor stimuli that failed to evoke a behavioral response, separated by anatomical nucleus. Gray traces show the behavior-triggered average for individual units (mean dF/F). Green traces are mean ± SEM. Right: percent of each cluster significantly correlated with regressors encoding stimuli not evoking a behavior. Pearson’s regression, alpha = 0.05. Dots represent single fish; red bar, mean; gray boxes, 95% CIs; gray lines, standard deviation. From left to right, n = 5, 8, 9, and 4 fish. (C) Barcode showing significant (black; p < 0.05) and non-significant (white; p > 0.05) regression results for individual units (n = 86 neurons, 8 fish). (D) Percent of each cluster significantly correlated to both acoustic stimulation not evoking a behavioral response and spontaneous motor behavior. Dots represent single fish; red bar, mean; gray boxes, 95% CIs; gray lines, standard deviation. From left to right, n = 5, 8, 9, and 4 fish. (E) Probability of evoked startle behavior following audiomotor and optogenetic stimulation in fish expressing chr2-eyfp under the th2 promoter as well as wild-type sibling controls. n = 5 wild type and 11 chr2+; Bonferroni-corrected ANOVA; p < 0.005. |