
|
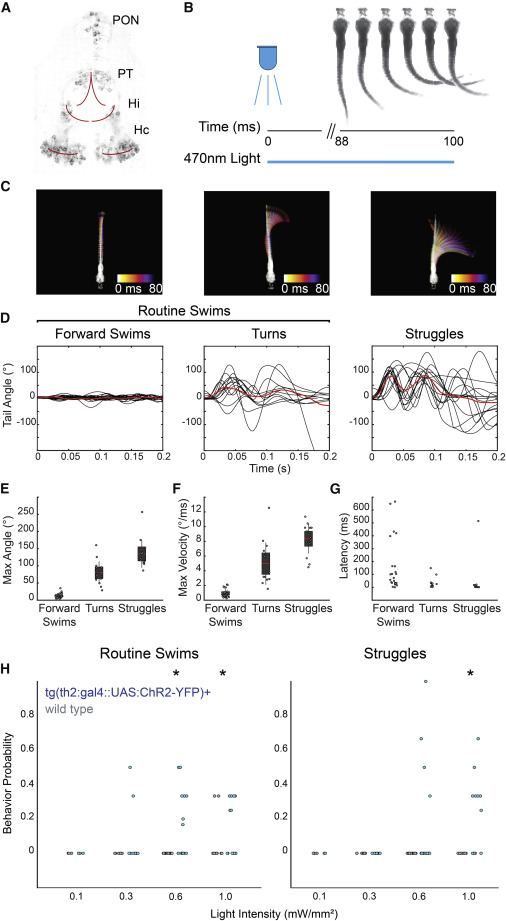
Fig. 1 Figure 1. Stimulation of th2+ Neurons Drives Locomotor Behavior (A) Two-photon fluorescence image of transgene expression in a Tg(th2:gfp-aequorin) animal. Expression is found in four anatomical clusters: the preoptic nucleus (PON), posterior tuberculum (PT), intermediate hypothalamus (Hi), and caudal hypothalamus (Hc). Red lines indicate approximate position of ventricles. (B) Experimental schematic. Eyeless fish were exposed to 100-ms pulses of 470-nm light at varying intensities, while the tail was imaged at 500 Hz. (C) Example behavior types evoked by stimulation of th2+ neurons and automatically classified by SOM clustering of kinematic parameters. Examples are shown in Video S1. Maximum intensity projections over the first 80 ms are shown; color represents time. (D) Tail angle traces of forward swims, turns, and struggle behaviors from all fish (n = 12 fish). Red trace, mean. (E–G) Max angle, max velocity, and latency of forward swims, turns, and struggles. Dots represent single trials; red bar, mean; gray boxes, 95% confidence intervals (CIs); gray lines, standard deviation. (H) Probability of evoked routine swims and c-bends following optogenetic stimulation in fish expressing chr2-yfp under the th2 promoter as well as wild-type sibling controls. Bonferroni-corrected Kruskal-Wallis test; n = 12 fish; p < 0.01; dots represent single animals.