
- Title
-
Tek/Tie2 is not required for cardiovascular development in zebrafish
- Authors
- Jiang, Z., Carlantoni, C., Allanki, S., Ebersberger, I., Stainier, D.Y.R.
- Source
- Full text @ Development
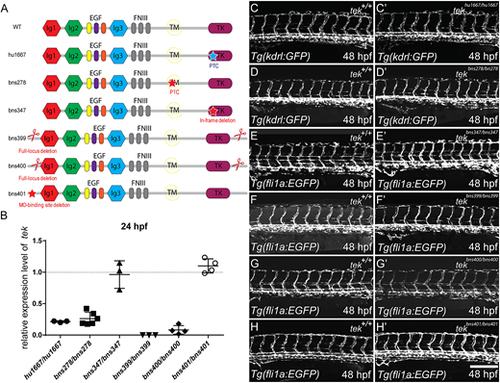
No gross vascular morphology defects in RNA-less or in-frame deletion zebrafish tek mutants. (A) Schematic representation of the Tek protein domains and the lesion in each allele. Blue star represents ENU-induced lesion; red stars and scissors represent CRISPR target sites. Lesions in tekhu1667 and tekbns278 result in a premature termination codon in the TK domain- and TM domain-encoding exons, respectively. The lesion in tekbns347 is an in-frame deletion that is predicted to severely impair Tek function (Fig. S1). tekbns399 and tekbns400 are full-locus deletion alleles. tekbns401 contains a 261 bp deletion around the translational start site. (B) tek expression levels in different tek mutant alleles when compared with their corresponding +/+ siblings at 24 hpf. (C-H′) Lateral views of 48 hpf trunk vessels. No obvious vascular phenotype is observed in any of these alleles (C′-H′) when compared with their corresponding +/+ siblings (C-H). PTC, premature termination codon; Ig, immunoglobulin domain; EGF, epidermal growth factor repeat; FNIII, fibronectin type 3 domain; TM, transmembrane domain; TK, tyrosine kinase domain. In B, data are mean±s.d. Scale bar: 200 μm. EXPRESSION / LABELING:
|
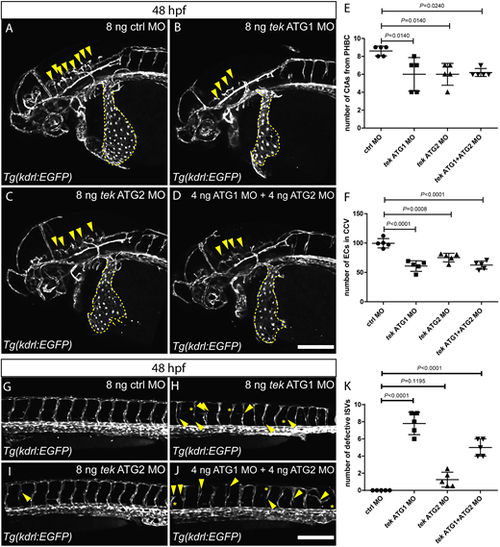
Zebrafish tek morphants display reduced angiogenesis and abnormal CCV formation. (A-D) Lateral views of 48 hpf head vasculature in embryos injected with 8 ng of control MO (A), 8 ng of tek ATG1 MO (B), 8 ng of tek ATG2 MO (C) or 4 ng of tek ATG1 MO plus 4 ng of tek ATG2 MO (D). Yellow arrowheads indicate central arteries (CtAs); yellow dashed lines outline the common cardinal veins (CCVs). (E) CtA numbers in different MO-injected groups at 48 hpf. (F) Endothelial cell numbers in the CCVs in different MO-injected groups at 48 hpf. (G-J) Lateral views of 48 hpf trunk vessels in embryos injected with 8 ng of control MO (G), 8 ng of tek ATG1 MO (H), 8 ng of tek ATG2 MO (I) or 4 ng of tek ATG1 MO plus 4 ng of tek ATG2 MO (J). Yellow arrowheads indicate abnormal intersegmental vessel (ISV) formation; yellow asterisks indicate absent ISVs. (K) Number of defective ISVs above the yolk extension in different MO-injected groups at 48 hpf. In E,F and K, data are mean±s.d. [one-way analysis of variance (ANOVA) followed by Tukey's HSD test]. Scale bars: 200 μm. |
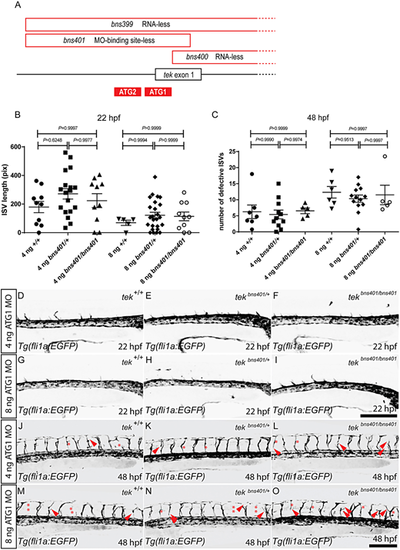
tek MO injections into zebrafish embryos lacking the MO-binding site cause vascular phenotypes. (A) Schematic representation of the deletions in the tekbns399, tekbns400 and tekbns401 alleles, and the location of the tek ATG1 and ATG2 MOs (only the 5′ end of the tek locus is shown). (B) Total length of 10 intersegmental vessels (ISVs) above the yolk extension in 22 hpf tekbns401/+ incrossed embryos injected with 4 or 8 ng of tek ATG1 MO. (C) Number of defective ISVs above the yolk extension in 48 hpf tekbns401/+ incrossed embryos injected with 4 or 8 ng of tek ATG1 MO. (D-F) Lateral views of trunk vessels in 22 hpf tekbns401/+ incrossed embryos injected with 4 ng of tek ATG1 MO. (G-I) Lateral views of trunk vessels in 22 hpf tekbns401/+ incrossed embryos injected with 8 ng of tek ATG1 MO. (J-L) Lateral views of trunk vessels in 48 hpf tekbns401/+ incrossed embryos injected with 4 ng of tek ATG1 MO. (M-O) Lateral views of trunk vessels in 48 hpf tekbns401/+ incrossed embryos injected with 8 ng of tek ATG1 MO. Red arrowheads indicate abnormal ISV formation; red asterisks indicate absent ISVs. In B and C, data are mean±s.d. [one-way analysis of variance (ANOVA) followed by Tukey's HSD test]. Scale bars: 200 μm. PHENOTYPE:
|
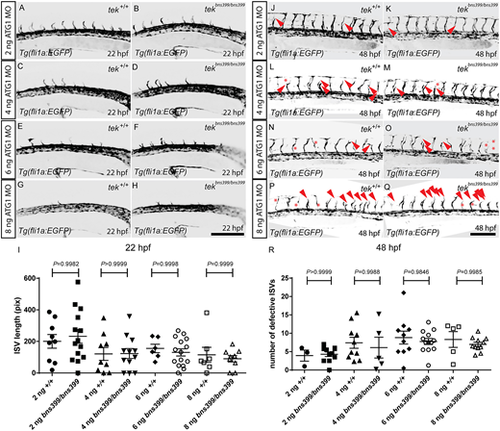
tek MO injections into the zebrafish tekbns399 RNA-less allele cause vascular phenotypes. (A-H) Lateral views of trunk vessels in 22 hpf tekbns399/+ incrossed embryos injected with 2 (A,B), 4 (C,D), 6 (E,F) or 8 (G,H) ng of tek ATG1 MO. (I) Total length of 10 intersegmental vessels (ISVs) above the yolk extension in 22 hpf tekbns399/+ incrossed embryos injected with 2, 4, 6 or 8 ng of tek ATG1 MO. (J-Q) Lateral views of trunk vessels in 48 hpf tekbns399/+ incrossed embryos injected with 2 (J,K), 4 (L,M), 6 (N,O) or 8 (P,Q) ng of tek ATG1 MO. Red arrowheads indicate abnormal ISV formation; red asterisks indicate absent ISVs. (R) Number of defective ISVs above the yolk extension in 48 hpf tekbns399/+ incrossed embryos injected with 2, 4, 6 or 8 ng of tek ATG1 MO. In I and R, data are mean±s.d. [by one-way analysis of variance (ANOVA) followed by Tukey's HSD test]. Scale bars: 200 μm. |
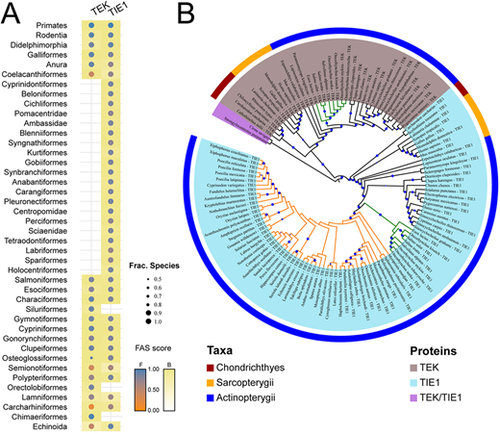
Loss of tek in the Acanthomorphata lineage. (A) Phylogenetic profile of TEK and TIE1 in deuterostomes on the order level. Colour code indicates the feature architecture similarity (FAS) score of the orthologues to the human seed protein. Dot size indicates the fraction of species subsumed in an order that carries an orthologue to the respective protein. (B) Phylogeny of TEK and TIE1. The coloured ring segments represent the three main vertebrate groups. TEK/TIE1 represents the primordial protein outside the vertebrates; TEK and TIE1 are each indicated by coloured taxa. The Acanthomorphata and their sister clade, the Salmoniformes, are indicated by orange and green branches, respectively. Branch labels reflect the percent bootstrap support, where the dot size is proportional to the support value. Only branches with a minimum bootstrap support of 50 are labelled. The tree is provided in Newick format in File S1 in the supplementary information, and the protein IDs of the TEK and TIE1 orthologues together with the protein sequences are provided in File S2 in the supplementary information. |