FIGURE SUMMARY
Title

ALX1-related frontonasal dysplasia results from defective neural crest cell development and migration

Authors
Pini, J., Kueper, J., Hu, Y.D., Kawasaki, K., Yeung, P., Tsimbal, C., Yoon, B., Carmichael, N., Maas, R.L., Cotney, J., Grinblat, Y., Liao, E.C.
Source
Full text @ EMBO Mol. Med.

Clinical presentation of the <styled-content toggle='no' style='fixed-case'>FND</styled-content> pedigree and generation of control, father, and subject‐derived <styled-content toggle='no' style='fixed-case'>iPSC</styled-content>

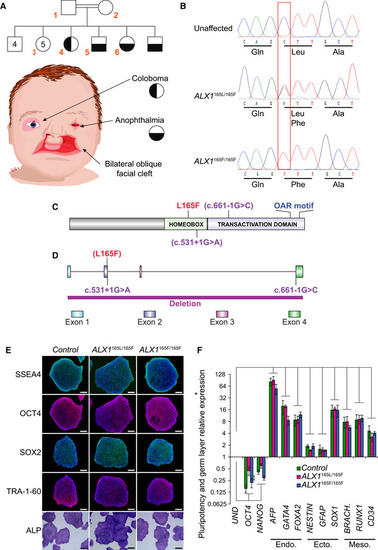
The pedigree family tree includes two unaffected parents, four unaffected male siblings, five unaffected female siblings, and two each female and male affected sibling. Subjects 1–6, indicated in red, were enrolled in the study. Subjects 4–6 show complex FND with ocular involvement. The eldest affected sibling (subject 4) presented with right coloboma, left microphthalmia, and bilateral Tessier 4 oblique facial clefts. Subject 5 presented with bilateral anophthalmia with fused eyelids and shallow orbits, with bilateral oblique facial clefts. Subject 6 presented with bilateral anophthalmia with open shallow orbits, absent upper and lower eyelids, exposed orbital mucosa, bilateral oblique facial clefts, and malformed nasal ala with nodular skin tags. iPSCs were generated using blood samples collected from subjects 1, 5, and 6.

Whole‐exome sequencing was carried out and analysis revealed a missense p.L165F variant (c.493 C>T) in the ALX1 homeodomain, heterozygous in the parents (ALX1165L/165F), wild type in the unaffected sibling (ALX1165L/165L), and homozygous in both affected subjects (ALX1165F/165F).

Schematic of the ALX1 protein structure showing the position of the L165F substitution described here (red) and the locations of exon borders affected by two reported pathogenic variants (purple; Ullah et al, 2016; Uz et al, 2010).

Schematic of the ALX1 genomic sequence, showing the locations of the three reported pathogenic variants. The purple bar at the bottom represents a FND‐associated homozygous ALX1 deletion previously reported in the literature (Uz et al, 2010; Ullah et al, 2016).

Immunofluorescence staining for pluripotent markers SSEA4, OCT4, SOX2, and TRA‐1-60 and alkaline phosphatase staining of iPSC clones. One representative iPSC clone is shown for each genotype. Scale bar: 400 μm.

Expression of pluripotent (OCT4, NANOG), endoderm (Endo., AFP, GATA4, FOXA2), ectoderm (Ecto., NESTIN, GFAP, SOX1), and mesoderm (Meso., BRACH. (BRACHYURY), RUNX1, CD34) gene markers for ALX1165L/165L (green), ALX1165L/165F(red), and ALX1165F/165F (blue) iPSC relative to undifferentiated cells (UND). Data are represented as pooled mean ± SEM of three experiments on three clones from each genotype. Significance: P = 0.0167 for OCT4, P = 0.0005 for NANOG, P = 0.000004 for AFP, P = 0.0082 for GATA4, P = 0.0137 for FOXA2, P = 0.00002 for NESTIN, P = 0.0167 for GFAP, P = 0.0014 for SOX1, P = 0.0117 for BRACHYURY, P = 0.0008 for RUNX1 and P = 0.0068 for CD34 when comparing undifferentiated and differentiated ALX1165L/165L iPSC. P = 0.0013 for OCT4, P = 0.0011 for NANOG, P = 0.0000003 for AFP, P = 0.0003 for GATA4, P = 0.0063 for FOXA2, P = 0.0001 for NESTIN, P = 0.027 for GFAP, P = 0.000002 for SOX1, P = 0.000009 for BRACHYURY, P = 3e−9 for RUNX1 and P = 0.000006 for CD34 when comparing undifferentiated and differentiated ALX1165F/165L iPSC. P = 0.0201 for OCT4, P = 0.006 for NANOG, P = 1 × 10−12 for AFP, P = 5 × 10‐13 for GATA4, P = 0.0031 for FOXA2, P = 0.0292 for NESTIN, P = 0.00001 for GFAP, P = 6 × 10‐7 for SOX1, P = 0.0204 for BRACHYURY, P = 0.0009 for RUNX1 and P = 0.000003 for CD34 when comparing undifferentiated and differentiated ALX1165F/165F iPSC. Data from each clone were pooled, and the mathematical mean was calculated. SEM was used to determine the standard error. To test statistical significance, an ANOVA test was performed. A P‐value < 0.05 was considered to be statistically significant.

Generation of <styled-content toggle='no' style='fixed-case'>iPSC</styled-content>‐derived NCC

Schematic of the differentiation protocol timeline. Maintenance Medium (MM) = iPSC medium (StemFlex with 1× penicillin/streptomycin), NCC differentiation medium = DMEM‐F12, 10% fetal bovine serum, 1 mM sodium pyruvate, 1 mM penicillin/streptomycin, 1 mM nonessential amino acids, 110 μM 2‐mercaptoethanol, 10 ng/ml epidermal growth factor.

Images of iPSC and iPSC‐derived NCC at Days 0, 14, and passage 4 following differentiation. Scale bars: 400 μm (Day 0), 200 μm (Day 14, passage 4).

Timeline of key <styled-content toggle='no' style='fixed-case'>NCC</styled-content>‐associated genes during differentiation

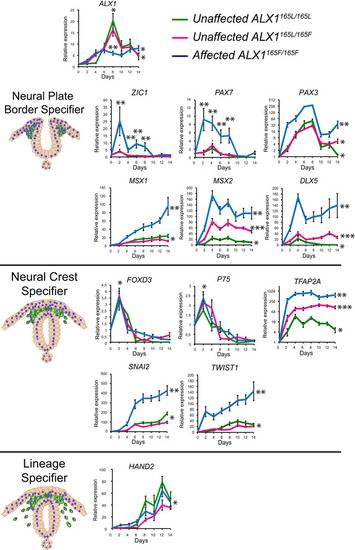
Gene expression analysis across
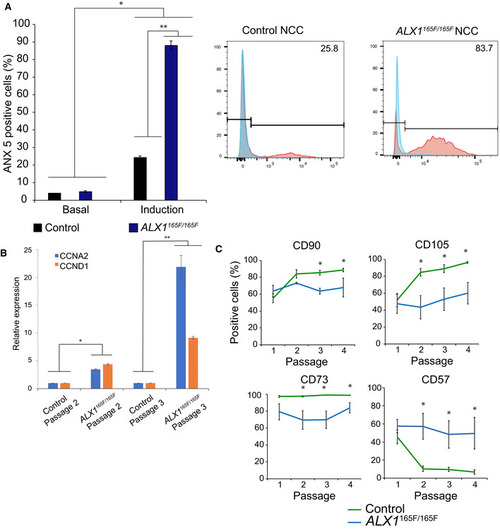
 NCC differentiation of unaffected control ALX1165L/165L (green), heterozygous ALX1165L/165F (magenta), and homozygous ALX1165F/165FiPSC:ALX1, neural plate border specifier genes ZIC1, PAX7, PAX3, MSX1, MSX2, DLX5; neural crest specifier genes FOXD3, P75, TFAP2A, SNAI2, TWIST1; and lineage specifier gene HAND2. The RTqPCR relative expression values were normalized to RPLP0 and GAPDH expression. Data are represented as pooled mean ± SEM of three experiments on three clones from each genotype. Exact P‐values are provided in Table EV1. Data from each clone were pooled, and the mathematical mean was calculated. SEM was used to determine the standard error. To test statistical significance, an ANOVA test was performed. A P‐value < 0.05 was considered to be statistically significant.

<styled-content toggle='no' style='fixed-case'>NCC</styled-content> apoptosis, cell cycle, and differentiation

Homozygous ALX1165F/165F NCC (blue) showed an increase in sensitivity to apoptosis when compared to control ALX1165L/165L NCC (black). The data on the left represent the mean percentage of Annexin V‐positive cells, indicative of apoptosis, as determined by FACS analysis, with the data on the right being an example of one such experiment. Apoptosis was induced by immersion in a 55°C water bath for 10 min. Representative experiment for each condition is shown. Data are represented as pooled mean ± SEM of three independent experiments. Data obtained of each clone from three independent experiments were pooled, and the mathematical mean was calculated. SEM was used to determine the standard error. To test statistical significance, an ANOVA test was performed. A P‐value < 0.05 was considered to be statistically significant. *: Significantly different from the basal apoptosis rate: P = 3 × 10−12 between control NCC basal apoptosis and induced apoptosis, and between ALX1165F/165F NCC basal apoptosis and induced apoptosis. **Significantly different from control NCC (P = 0.0004).

Expression levels of cyclins CCNA2 (blue) and CCND1 (orange) in NCC at passages 2 and 3 of ALX1165L/165L and ALX1165F/165F NCC. The RT–qPCR relative expression values were normalized to RPLP0 and GAPDH expression. Data are represented as pooled mean ± SEM of three experiments on three clones from each genotype. *Significantly different from control NCC at passage 2 (P = 0.001 between control and ALX1165F/165F NCC at passage 2 for CCNA2, P = 0.0052 for CCND1). **Significantly different from control NCC at passage 3 (P = 0.0494 between control and ALX1165F/165F NCC for CCNA2, P = 0.0008 for CCND1).

Fluorescence activated cell sorting (FACS) experiments showed that control
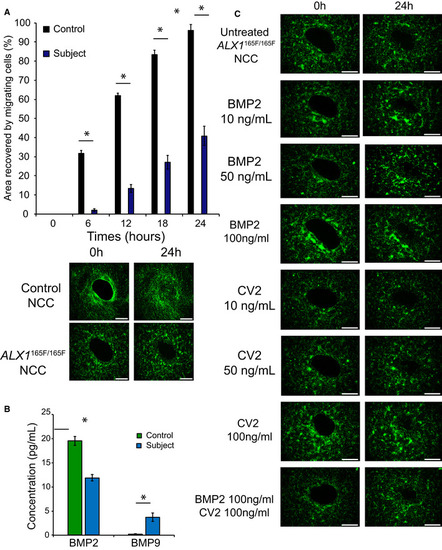
 ALX1165L/165L NCC (green) exhibited increased expression of mesenchymal markers CD90, CD105, and CD73 with culture time (passages 1 through 4), whereas homozygous ALX1165F/165F NCC (blue) showed a consistent expression of the markers expressed at passage 1 throughout. Further, control ALX1165L/165L NCC showed a downregulation of CD57 expression with culture time, while ALX1165F/165F NCC maintained the same level of CD57 across passages. Data are presented as the mean percentage of positive‐stained cells across passage numbers. Data obtained of each clone from three independent experiments were pooled, and the mathematical mean was calculated. SEM was used to determine the standard error. To test statistical significance, an ANOVA test was performed. A P‐value < 0.05 was considered to be statistically significant. *Significantly different from control NCC. For CD90, P = 0.0013 at passage 3 and P = 0.0207 at passage 4. For CD105, P = 0.0016 at passage 2, P = 0.00004 at passage 3 and P = 0.0021 at passage 4. For CD73, P = 0.0060 at passage 2, P = 0.00004 at passage 3 and P = 0.0114 at passage 4. For CD57, P = 0.0026 at passage 2, P = 0.000003 at passage 3 and P = 0.000007 at passage 4.

<italic><styled-content toggle='no' style='fixed-case'>ALX</styled-content>1</italic><sup><italic>165F/165F</italic></sup><styled-content toggle='no' style='fixed-case'>NCC</styled-content> show a migration defect and a difference in <styled-content toggle='no' style='fixed-case'>BMP</styled-content> secretion

Mutant ALX1165F/165F NCC (blue) exhibited a migration defect in timed coverage of the central clearing of the wound assay when compared with control ALX1165L/165L NCC (black). Data are presented as percent area recovery of the central circular clear area of the wound assay by migrating NCC at the end of a 24‐h period. For fluorescent pictures, cells were stained in serum‐free media containing 3.6 μM CellTracker Green CMFDA (Life Technologies) for 30 min at 37°C and allowed to recover for 30 min before starting the experiment. Images were acquired every 6 h using a Keyence BZ‐X800 microscope. Surface area analyses and percentages of coverage were measured using ImageJ software (NIH). The NCC were monitored over 24 h. The data are represented as the average of the percentage of closure ± SEM. Scale bar = 200 μm. Data obtained of each clone from three independent experiments were pooled, and the mathematical mean was calculated. SEM was used to determine the standard error. To test statistical significance, an ANOVA test was performed. A P‐value < 0.05 was considered to be statistically significant. *Significantly different from control NCC (P < 0.0001).

Multiplex analysis of BMP2 and BMP9 in the supernatant of cultured NCC showed that ALX1165F/165F NCC (blue) secrete less BMP2 and more BMP9 compared to control ALX1165L/165L NCC (green). Data are represented as pooled mean ± SEM of three clones from each genotype. Statistical significance was determined with an ANOVA test. A P‐value < 0.05 was considered significant. *Significantly different from control NCC (P = 0.0424 for BMP2 and P = 0.0192 for BMP9).

Addition of soluble BMP2 or CV2, a BMP9 antagonist, to the culture medium could partially rescue the migration defect of
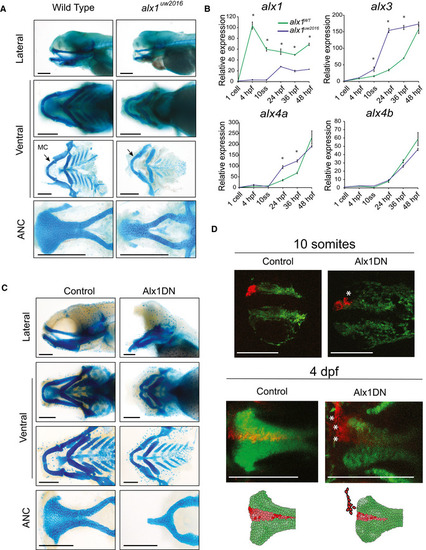
 ALX1165F/165F NCC. At the beginning of the assay, 10, 50, or 100 ng/ml of soluble BMP2, CV2, or a combination of the two at 100 ng/ml each were added to the culture medium, and the cells were monitored over the next 24 h. The data are represented as the average of the percentage of closure ± SEM. Scale bar: 400 μm.

<italic>Alx1</italic> function in zebrafish

Dissected flatmount wild‐type and alx1−/− zebrafish larvae craniofacial cartilages after Alcian blue staining, the anterior points to the left of the page in all images. The ventral cartilages appear normal, but the alx1−/− anterior neurocranium (ANC) appears narrow, with the midline element that is derived from the frontonasal NCC being absent. Meckel's cartilage (arrow, MC) is also diminutive. Scale bar: 200 μm.

Zebrafish alx1 mutants (blue) show reduced detectable expression of alx1 but increased expression of alx3, alx4a compared to wild‐type controls (green). alx4b expression levels are similar between wild‐type and alx1−/− lines. Data are represented as the mean of all pooled embryos from three different clutches. The RT–qPCR relative expression values were normalized to elfa and 18S expression using the ΔΔCT method. Data from each clutch were pooled, and the mathematical mean was calculated. SEM was used to determine the standard error. To test statistical significance, an ANOVA test was performed. A P‐value < 0.05 was considered to be statistically significant. Statistical significance denoted by *; P < 0.0001 between WT zebrafish and alx1−/− at all measured time points; at 10 ss, 24 hpf and 36 hpf for alx3; and at 24 hpf and 36 hpf for alx4a. Refer to Table EV2 for P‐values.

Dissected flatmount of zebrafish embryos injected with Alx1DN, after Alcian blue staining. The embryos developed an absence of the frontonasal‐derived median portion of the anterior neurocranium (ANC) and a profound hypoplasia of Meckel's and ventral cartilages. In the most severely affected zebrafish, a nearly abrogated ANC was observed. Scale bar: 200 μm.

Lineage tracing experiments in control and Alx1DN mutant embryos revealed aberrant migration of anterior cranial NCC when alx1 is disrupted. In the control animal, the anterior cranial NCC always migrate to contribute to the median portion of the ANC. In contrast, the anterior cranial NCC labeled in the Alx1DN animals fail to migrate to the median ANC, where the ANC structure is narrower and the labeled cranial NCC are found in an anterior and lateral ectopic location (white asterisks). Scale bar: 250 μm.

Induced pluripotent stem cells (<styled-content toggle='no' style='fixed-case'>iPSC</styled-content>) derivation and <styled-content toggle='no' style='fixed-case'>EB</styled-content> generation

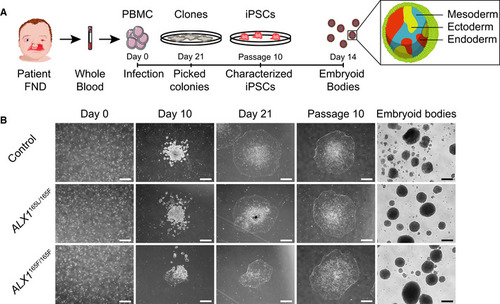
Schematic representation of the strategy used to generate iPSC. Blood samples from an unrelated normal individual, unaffected father (subject 1), and two of the affected children (subjects 5 and 6) were processed. Isolated PBMC were infected with Sendai virus, and individual clones were picked 21 days after the infection. Following expansion until passage 10, iPSC were characterized and embryoid bodies were formed by suspension culture for 14 days.

The reprogramming process of the PBMC showed that all cells underwent similar morphological changes leading to the formation of iPSC clones by day 21. These clones still displayed embryonic stem cells morphology at passage 10, indicating that the cells are able to self‐renew. All iPSC clones were able to form EBs. One clone of each subject is represented. Scale bar is 400 μm.

Characterization of <styled-content toggle='no' style='fixed-case'>NCC</styled-content>

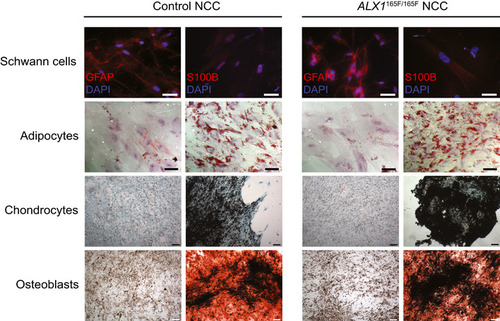
Multilineage differentiation experiments revealed that both control and subject‐derived NCC are able to differentiate into Schwann cells, shown by the GFAP and S100B‐positive immunofluorescence staining; adipocytes, demonstrated by the Oil Red O. positive lipidic droplets; osteoblasts, shown by Alizarin Red S. positive mineralized nodules and chondrocytes, assessed by Alcian Blue‐positive cartilaginous matrix. Scale bar is 200 μm for images of Schwann cells and adipocytes, and 400 μm for images of chondrocytes and osteoblasts.

Effect of <styled-content toggle='no' style='fixed-case'>BMP</styled-content>2 and <styled-content toggle='no' style='fixed-case'>CV</styled-content>2 on <styled-content toggle='no' style='fixed-case'>NCC</styled-content> migration

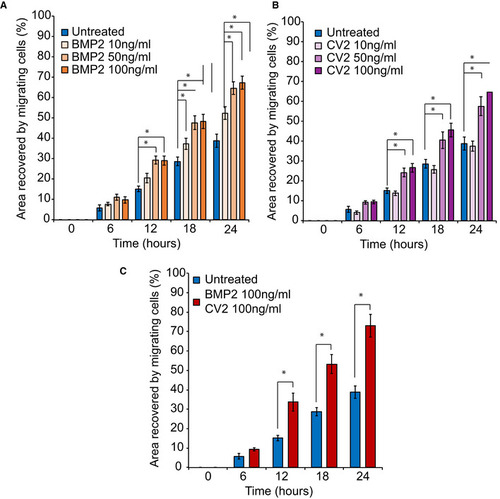
10, 50, or 100 ng/ml of soluble BMP2 was added to the culture medium. Surface area analyses and percentages of coverage were measured using ImageJ software (NIH). The data of NCC migration following the treatment with 10, 50, and 100 ng/ml soluble BMP2 are represented as the average of the percentage of closure ± SEM from three independent experiments performed with each clone. To test statistical significance, an ANOVA test was performed. A P‐value < 0.05 was considered to be statistically significant *: Significantly different from untreated ALX1165F/165F NCC: at 12 h, P = 0.0038 when comparing BMP2 50 ng/ml and untreated ALX1165F/165F NCC, and P = 0.0045 when comparing BMP2 100 ng/ml and untreated ALX1165F/165F NCC. At 18 h, P = 0.0337 when comparing BMP2 10 ng/ml and untreated ALX1165F/165F NCC; P = 0.0009 when comparing BMP2 50 ng/ml and untreated ALX1165F/165F NCC; and P = 0.0006 when comparing BMP2 100 ng/ml and untreated ALX1165F/165F NCC. At 24 h, P = 0.005 when comparing BMP2 10 ng/ml and untreated ALX1165F/165F NCC; P < 0.0001. when comparing BMP2 50 ng/ml and untreated ALX1165F/165F NCC; and P < 0.0001 when comparing BMP2 100 ng/ml and untreated ALX1165F/165F NCC.

10, 50, or 100 ng/ml of soluble CV2 was added to the culture medium. Surface area analyses and percentages of coverage were measured using ImageJ software (NIH). The data of NCC migration following the treatment with 10, 50, and 100 ng/ml soluble CV2 are represented as the average of the percentage of closure ± SEM. Scale bar = 400 μm. *: Significantly different from untreated ALX1165F/165F NCC: at 12 h, P = 0.0146 when comparing CV2 50 ng/ml and untreated ALX1165F/165F NCC, and P = 0.0262 when comparing CV2 100 ng/ml and untreated ALX1165F/165F NCC. At 18 h, P = 0.0028 when comparing CV2 50 ng/ml and untreated ALX1165F/165F NCC, and P = 0.0035 when comparing CV2 100 ng/ml and untreated ALX1165F/165F NCC. At 24 h, P = 0.0002 when comparing CV2 50 ng/ml and untreated ALX1165F/165F NCC, and P < 0.0001 when comparing CV2 100 ng/ml and untreated ALX1165F/165F NCC.

Recovery of subject‐derived NCC migration in a migration assay following the combined treatment with 100 ng/ml each of soluble BMP2 and CV2. The data are represented as the average of the percentage of closure ± SEM from three independent experiments performed with each clone. To test statistical significance, an ANOVA test was performed. A P‐value < 0.05 was considered to be statistically significant * : Significantly different from ALX1165F/165F NCC: at 12 h, P = 0.0031, at 18 h P = 0.0001, and at 24 h P < 0.0001).

<styled-content toggle='no' style='fixed-case'>CRISPR</styled-content>/Cas9 targeted mutagenesis of <italic>alx1</italic> in zebrafish

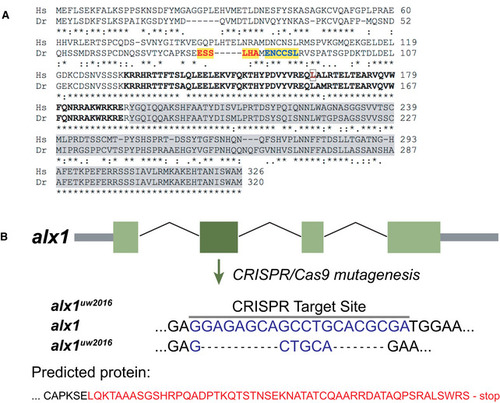
Human ALX1 and zebrafish alx1 protein sequences were obtained from Ensembl and aligned using Clustal Omega (https://www.ebi.ac.uk/Tools/msa/clustalo/) under the default settings. The homeobox DNA‐binding domain is shown in bold, with the amino acid residue mutated in the subjects indicated by an outline. The transactivation domain is shaded in gray. Zebrafish alx1 CRISPR sites #1 and #2 are highlighted in yellow. The red and blue letters visually demarcate the sites.

Schematic diagram shows the effect of the mutant allele resulting from our choice of target site #1. The allele, termed, alx1uw2016, has a net deletion of 16 nucleotides. Red letters denote the abnormal sequence that results from the frameshift mutation.

Qualitative and quantitative characterization of zebrafish mutants

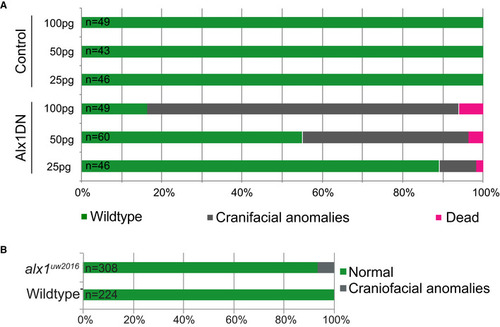
The number of embryos displaying craniofacial phenotypes increased with increasing concentration of Alx1DN mRNA injected into the single cell stage embryo. Overview of the relationship of the results of injections of 25, 50, and 100 pg of control mRNA and Alx1DN mRNA with the outcomes of wild‐type zebrafish (green), a craniofacial phenotype (gray), and dead zebrafish (magenta).

The number of embryos displaying craniofacial phenotypes injected with alx1uw2016 mRNA was very low. Overview of the percent of injected wild‐type zebrafish displaying a craniofacial phenotype (gray), compared with uninjected wild‐type zebrafish from the identical clutches (gray). Data of the injections are presented as a comparative percentage.

Acknowledgments
This image is the copyrighted work of the attributed author or publisher, and ZFIN has permission only to display this image to its users. Additional permissions should be obtained from the applicable author or publisher of the image. Full text @ EMBO Mol. Med.