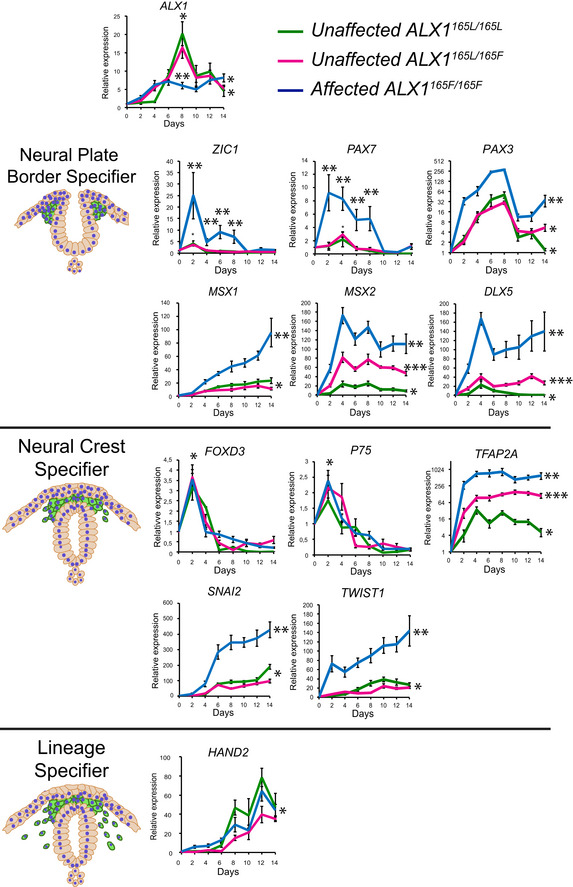
IMAGE

Fig. 3

ID
ZDB-IMAGE-201012-93
Source
Figures for Pini et al., 2020
Image
Figure Caption

Fig. 3 Timeline of key <styled-content toggle='no' style='fixed-case'>NCC</styled-content>‐associated genes during differentiation

Gene expression analysis across NCC differentiation of unaffected control ALX1165L/165L (green), heterozygous ALX1165L/165F (magenta), and homozygous ALX1165F/165FiPSC:ALX1, neural plate border specifier genes ZIC1, PAX7, PAX3, MSX1, MSX2, DLX5; neural crest specifier genes FOXD3, P75, TFAP2A, SNAI2, TWIST1; and lineage specifier gene HAND2. The RTqPCR relative expression values were normalized to RPLP0 and GAPDH expression. Data are represented as pooled mean ± SEM of three experiments on three clones from each genotype. Exact P‐values are provided in Table EV1. Data from each clone were pooled, and the mathematical mean was calculated. SEM was used to determine the standard error. To test statistical significance, an ANOVA test was performed. A P‐value < 0.05 was considered to be statistically significant.

Acknowledgments
This image is the copyrighted work of the attributed author or publisher, and ZFIN has permission only to display this image to its users. Additional permissions should be obtained from the applicable author or publisher of the image. Full text @ EMBO Mol. Med.