IMAGE

Fig. EV3

ID
ZDB-IMAGE-201012-114
Source
Figures for Pini et al., 2020
Image
Figure Caption

Fig. EV3 Effect of <styled-content toggle='no' style='fixed-case'>BMP</styled-content>2 and <styled-content toggle='no' style='fixed-case'>CV</styled-content>2 on <styled-content toggle='no' style='fixed-case'>NCC</styled-content> migration

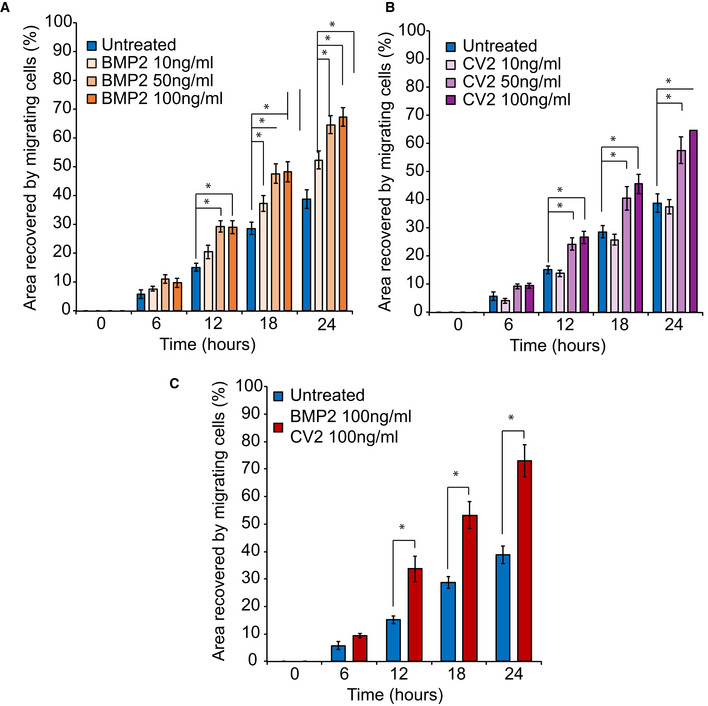
10, 50, or 100 ng/ml of soluble BMP2 was added to the culture medium. Surface area analyses and percentages of coverage were measured using ImageJ software (NIH). The data of NCC migration following the treatment with 10, 50, and 100 ng/ml soluble BMP2 are represented as the average of the percentage of closure ± SEM from three independent experiments performed with each clone. To test statistical significance, an ANOVA test was performed. A P‐value < 0.05 was considered to be statistically significant *: Significantly different from untreated ALX1165F/165F NCC: at 12 h, P = 0.0038 when comparing BMP2 50 ng/ml and untreated ALX1165F/165F NCC, and P = 0.0045 when comparing BMP2 100 ng/ml and untreated ALX1165F/165F NCC. At 18 h, P = 0.0337 when comparing BMP2 10 ng/ml and untreated ALX1165F/165F NCC; P = 0.0009 when comparing BMP2 50 ng/ml and untreated ALX1165F/165F NCC; and P = 0.0006 when comparing BMP2 100 ng/ml and untreated ALX1165F/165F NCC. At 24 h, P = 0.005 when comparing BMP2 10 ng/ml and untreated ALX1165F/165F NCC; P < 0.0001. when comparing BMP2 50 ng/ml and untreated ALX1165F/165F NCC; and P < 0.0001 when comparing BMP2 100 ng/ml and untreated ALX1165F/165F NCC.

10, 50, or 100 ng/ml of soluble CV2 was added to the culture medium. Surface area analyses and percentages of coverage were measured using ImageJ software (NIH). The data of NCC migration following the treatment with 10, 50, and 100 ng/ml soluble CV2 are represented as the average of the percentage of closure ± SEM. Scale bar = 400 μm. *: Significantly different from untreated ALX1165F/165F NCC: at 12 h, P = 0.0146 when comparing CV2 50 ng/ml and untreated ALX1165F/165F NCC, and P = 0.0262 when comparing CV2 100 ng/ml and untreated ALX1165F/165F NCC. At 18 h, P = 0.0028 when comparing CV2 50 ng/ml and untreated ALX1165F/165F NCC, and P = 0.0035 when comparing CV2 100 ng/ml and untreated ALX1165F/165F NCC. At 24 h, P = 0.0002 when comparing CV2 50 ng/ml and untreated ALX1165F/165F NCC, and P < 0.0001 when comparing CV2 100 ng/ml and untreated ALX1165F/165F NCC.

Recovery of subject‐derived NCC migration in a migration assay following the combined treatment with 100 ng/ml each of soluble BMP2 and CV2. The data are represented as the average of the percentage of closure ± SEM from three independent experiments performed with each clone. To test statistical significance, an ANOVA test was performed. A P‐value < 0.05 was considered to be statistically significant * : Significantly different from ALX1165F/165F NCC: at 12 h, P = 0.0031, at 18 h P = 0.0001, and at 24 h P < 0.0001).

Acknowledgments
This image is the copyrighted work of the attributed author or publisher, and ZFIN has permission only to display this image to its users. Additional permissions should be obtained from the applicable author or publisher of the image. Full text @ EMBO Mol. Med.