
- Title
-
Muscle defects due to perturbed somite segmentation contribute to late adult scoliosis
- Authors
- Lleras-Forero, L., Newham, E., Teufel, S., Kawakami, K., Hartmann, C., Hammond, C.L., Knight, R.D., Schulte-Merker, S.
- Source
- Full text @ Aging (Albany NY)
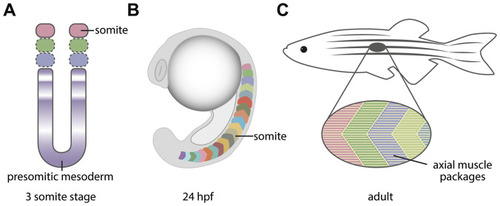
Graphical depiction of how the segmentation of the presomitic mesoderm leads to the formation of the axial myotome. (A) The oscillation of Notch-Delta genes leads to the segmentation of the presomitic mesoderm into somites. The 3 somite stage is shown. (B) The somites are transient structures with a chevron shape in the paraxial mesoderm of the zebrafish embryo, and will generate the axial muscles and later aspects of the vertebrae. (C) The adult zebrafish musculature presents the same segmental periodicity as the embryonic somites. |
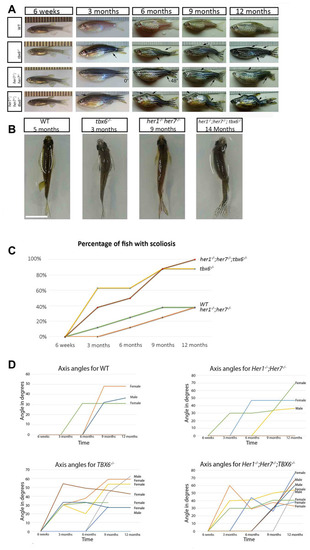
Clock segmentation mutants develop adult scoliosis. (A) Representative time lapse images of individuals from each genotype over the period from 6 weeks to 12 months, allowing to track the development of scoliosis (arrow). Mutant individuals have already mild signs of scoliosis at 3 months, while wild type exhibit the first indication of deviation from the body axis at 6 months. In the her1-/-; her7-/- individual at 3 and 6 months is an exemplary depiction of how scoliosis measurements were carried out. (B) Dorsal view of the different genotypes, showing an S body shape characteristic for scoliosis. (C) Graphical representation of the percentage of fish developing scoliosis over time, reaching 100% in the triple mutants and 83% in the tbx6-/- at the end point. In the wild type and in the her1-/-; her7-/- mutants only 38% presented scoliosis. (D) Measurements of axis angles in different individuals at different time points during virtual time-lapse. Only the individuals with an angle of deviation from the body axis are shown in the graph, none bended individuals have an angle of zero. Different line colours represent individual fish. Between 9 and 12 months, two wild type fish (1 with scoliosis and 1 without scoliosis), one her1-/-; her7-/- (with scoliosis) and two tbx6-/- (both with scoliosis) had to be sacrificed. After the individual was removed, it was still counted as bended or normal in the 12-month quantification. Note: the angle can decrease or increase depending on how the angle of deviation from the body axis develops over time in the individual. The ruler in section A serves as a scale bar, the space between two successive lines marks one millimetre. The scale bar in section B represents 1 cm. PHENOTYPE:
|
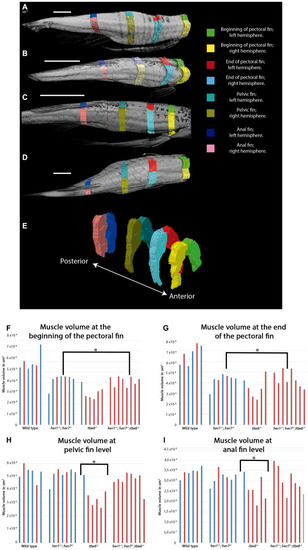
Muscle volume is affected in mutants at adult stages. (A–D) Representative micro CT images showing the dorsal view of fish used for the segmentation of muscles into the left and right side at the four key areas (indicated by the colored regions) in the 4 different groups: (A) wild type, (B) tbx6-/- (C) her1-/-;her7-/-, and (D) her1-/-;her7-/-;tbx6-/-. (E) Lateral view of reconstructed surface generation of the individual muscle from the WT. (F–I) graphical results of the volume measurements for every area. (F) Muscle volume at the beginning of the pectoral fin. (G) Muscle volume at the end of the pectoral fin. (H) Muscle volume at pelvic fin level. (I) Muscle volume at anal fin level. An asterisk denotes a statistically significant difference between wild type and mutant groups (two tailed significant test P=0,05). Individuals that presented scoliosis during the course of the experiment (represented with red bars) tend to have the same muscle volume as their phenotypically normal siblings (represented with blue bars). The three mutants analyzed have less muscle volume at the first two anterior positions. The muscle of 27 out of 32 individuals could be analyzed to 12 months, because two wild type fish (1 with scoliosis and 1 without scoliosis), one her1-/-; her7-/- individual (with scoliosis) and two tbx6-/- individuals (both with scoliosis) had to be euthanized between 9 months and one year. After the individual was removed, it was not stained for muscle analysis and therefore will not appear in the graph. PHENOTYPE:
|
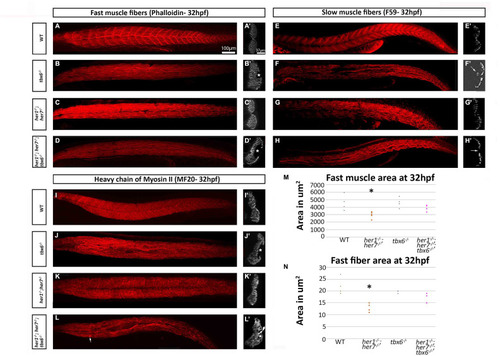
Fast and slow muscle fibers are affected in mutants at embryonic stages. (A–D) Phalloidin staining for fast muscle fibers in all mutants show loss of the characteristic metameric structure. (A) In addition, the transverse plane sections at the cloacal level in tbx6-/- and her1-/-; her7-/-; tbx6-/- display hollow cavities where no muscle fibers were present (B´ and D´). F59 staining for slow muscle fibers (E–H) also demonstrates loss of the characteristic metameric patterning in the mutants. tbx6-/- and her1-/-; her7-/-; tbx6-/- mutants present fusions of the fibers and cavities (F, F´ and H´). The her1-/-; her7-/- slow fibers resemble wild type fibers in sections (G´). The marker for striated muscle, MF20 (I–L) shows the same phenotype as phalloidin and allows the visualisation of aggregates of the fibers near the areas where there are lesions in the her1-/-; her7-/-; tbx6-/- mutants (arrow in L´). Quantifications of fast muscle area (M) and fiber cross-sectional area (N) at 32hpf display a statistically significant decrease (p= 0.03 and p= 0.009 respectively) of these two criteria in the her1-/-; her7-/ - mutants. In both figures, 6 points were measured. An asterisk denotes when the difference between the wild types and mutants is statistically different (p<0.05). |

ZFIN is incorporating published figure images and captions as part of an ongoing project. Figures from some publications have not yet been curated, or are not available for display because of copyright restrictions. |
|
ZFIN is incorporating published figure images and captions as part of an ongoing project. Figures from some publications have not yet been curated, or are not available for display because of copyright restrictions. PHENOTYPE:
|
|
ZFIN is incorporating published figure images and captions as part of an ongoing project. Figures from some publications have not yet been curated, or are not available for display because of copyright restrictions. PHENOTYPE:
|
|
Unillustrated author statements PHENOTYPE:
|