
- Title
-
Zebrafish Nedd8 facilitates ovarian development and the maintenance of female secondary sexual characteristics via suppression of androgen receptor activity
- Authors
- Yu, G., Liu, X., Zhang, D., Wang, J., Ouyang, G., Chen, Z., Xiao, W.
- Source
- Full text @ Development

Loss of nedd8 in zebrafish causes defects in ovarian maturation and reduces female ratio, ovulation rate and fertilization rate. (A) The sex ratios of nedd8+/− and nedd8−/− progeny generated by nedd8+/− (♀)×nedd8−/− (♂) matings. Histograms show percentages of females and males in 150 crossbreed offspring. (B) The ovulation rates (n=8; number of spawned females/the total number of females tested×100) of the nedd8+/+ and nedd8−/− female zebrafish mated with nedd8+/+ male zebrafish (n=11). (C) The fertilization rates of nedd8+/+ and nedd8−/− eggs. The fertilization rates were determined by mating nedd8+/+ and nedd8−/− female zebrafish with nedd8+/+ male zebrafish. (D) Bodies, ovaries and dissected eggs from a nedd8-null female zebrafish (nedd8−/−) and her wild-type sibling (nedd8+/+) at 4 mpf. Images show the elongated body, transparent ovaries and degenerated eggs of the nedd8−/− adult female, and the rounded body, egg-filled ovaries and mature eggs of the nedd8+/+ adult female. (E) The GSI of the nedd8+/+ and nedd8−/− females at 4 mpf (n=7). (F) H&E staining of the ovaries of wild-type zebrafish (nedd8+/+) (n=10; 100%) and nedd8-knockout zebrafish (nedd8−/−) (n=12; 75%) at 4 mpf. (G) The percentage of oocytes at different stages of development in wild-type zebrafish (nedd8+/+) and nedd8-null zebrafish (nedd8−/−) at 4 mpf (three sections/fish; six fish/genotype). Each dot represents average number of oocytes in one section. PG, primary growth stage; PV, previtellogenic stage (7-140 μm in diameter); EV, early vitellogenic stage (140-340 μm in diameter); MV, midvitellogenic stage (340-369 μm in diameter); FG, full-grown stage (0.69-0.70 mm in diameter). Data are mean±s.e.m. **P<0.01, ***P<0.001, ****P<0.0001 (one way ANOVA test). ns, not significant. PHENOTYPE:
|
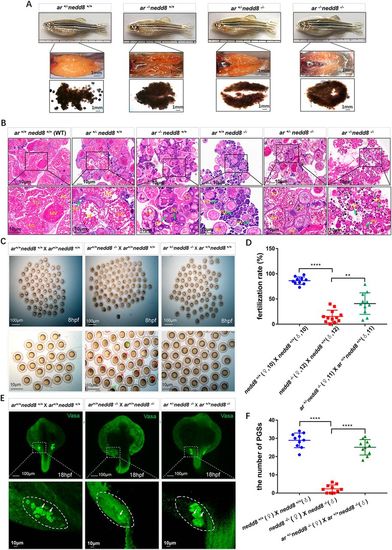
Loss of ar partially rescues nedd8−/− ovarian function. (A) Morphological comparison of ovaries and eggs from ar+/−nedd8+/+, ar−/−nedd8+/+, ar+/−nedd8−/− and ar−/−nedd8−/− female zebrafish at 4 mpf. Compared with the ovaries of the ar+/+nedd8−/− zebrafish (i.e. nedd8−/−; Fig. 1D), the ovaries of the ar+/−nedd8−/− zebrafish were filled with more oocytes in the midvitellogenic stage. (B) Histological analyses of the ovaries from female zebrafish with different genotypes at 4 mpf. Compared with oogenesis in the ar+/+nedd8−/− ovaries, oogenesis in ar+/−nedd8−/− ovaries was relatively normal. Green arrows indicate oocytes in different developmental stages. Bottom panels show magnification of the boxed areas in top panels. (C) Whole-mount images of embryos produced by different matings: ar+/+nedd8+/+ (♀)×ar+/+nedd8+/+ (♂); ar+/+nedd8−/− (♀)×ar+/+nedd8+/+ (♂); and ar+/−nedd8−/− (♀)×ar+/+nedd8+/+ (♂). The fertilization rate (number of fertilized eggs/total eggs laid×100) of the ar+/+nedd8−/− (♀)×ar+/+nedd8+/+ (♂) eggs was significantly lower than that of the ar+/−nedd8−/− (♀)×ar+/+nedd8+/+ (♂) eggs. Red arrows indicate degenerated embryos; green arrows indicate normal embryos. (D) Quantitation of the fertilization rates of different matings: ar+/+nedd8+/+ (♀)×ar+/+nedd8+/+ (♂) (n=10); ar+/+nedd8−/− (♀)×ar+/+nedd8+/+ (♂) (n=12); and ar+/+nedd8−/− (♀)×ar+/+nedd8+/+ (♂) (n=11). (E) Immunofluorescent staining of Vasa in PGCs of embryos (n=40) at 18 hpf from different matings: ar+/+nedd8+/+ (♀)×ar+/+nedd8+/+ (♂); ar+/+nedd8−/− (♀)×ar+/+nedd8−/− (♂); and ar+/−nedd8−/− (♀)×ar+/+nedd8−/− (♂). (F) The scatterplots represent PGC numbers in ar+/+nedd8+/+, ar+/+nedd8−/− and ar+/+nedd8−/−×ar+/− nedd8−/− embryos at 18 hpf. The numbers of PGCs were counted using a Leica dissection microscope based on the immunofluorescent density. EV, early vitellogenic stage; FG, full-grown stage; MV, midvitellogenic stage; PG, primary growth stage; PV, previtellogenic stage. Data are mean±s.e.m. **P<0.01, ****P<0.0001 (unpaired Student's t-test). PHENOTYPE:
|
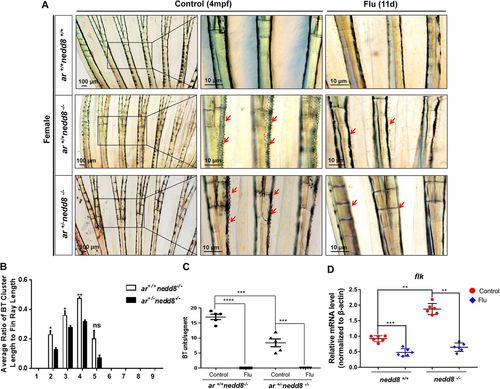
Loss of ar and/or treatment with the androgen antagonist flutamide eliminates BTs on the pectoral fins of nedd8−/− female zebrafish. (A) Images showing the effects of flutamide (Flu) treatment or ar knockout on the nedd8-knockout-induced BTs on the pectoral fins of female ar+/+nedd8−/− and ar+/−nedd8−/− zebrafish at 4 mpf. The red arrows indicate BTs. Panels on right show magnification of areas indicated by boxed areas on left. (B) Ratio of BT cluster length to pectoral fin ray length in ar+/+nedd8−/− (n=6) and ar+/−nedd8−/− (n=6) female zebrafish (4 mpf), plotted against pectoral fin ray number. (C) BTs/segment in ar+/+nedd8−/− (n=6) and ar+/−nedd8−/− (n=6) female zebrafish (4 mpf), treated with 2 mg/l flutamide for 11 days or untreated (control). (D) flk gene expression in the pectoral fins of nedd8+/+ (n=6) and nedd8−/− (n=6) female zebrafish (4 mpf) treated with 2 mg/l flutamide for 11 days or untreated (control). Gene expression was quantified using quantitative real-time PCR (qPCR). Data are mean±s.e.m. *P<0.05, **P<0.01, ***P<0.001, ****P<0.0001 (unpaired Student's t-test). |

ZFIN is incorporating published figure images and captions as part of an ongoing project. Figures from some publications have not yet been curated, or are not available for display because of copyright restrictions. |
|
ZFIN is incorporating published figure images and captions as part of an ongoing project. Figures from some publications have not yet been curated, or are not available for display because of copyright restrictions. PHENOTYPE:
|