
|
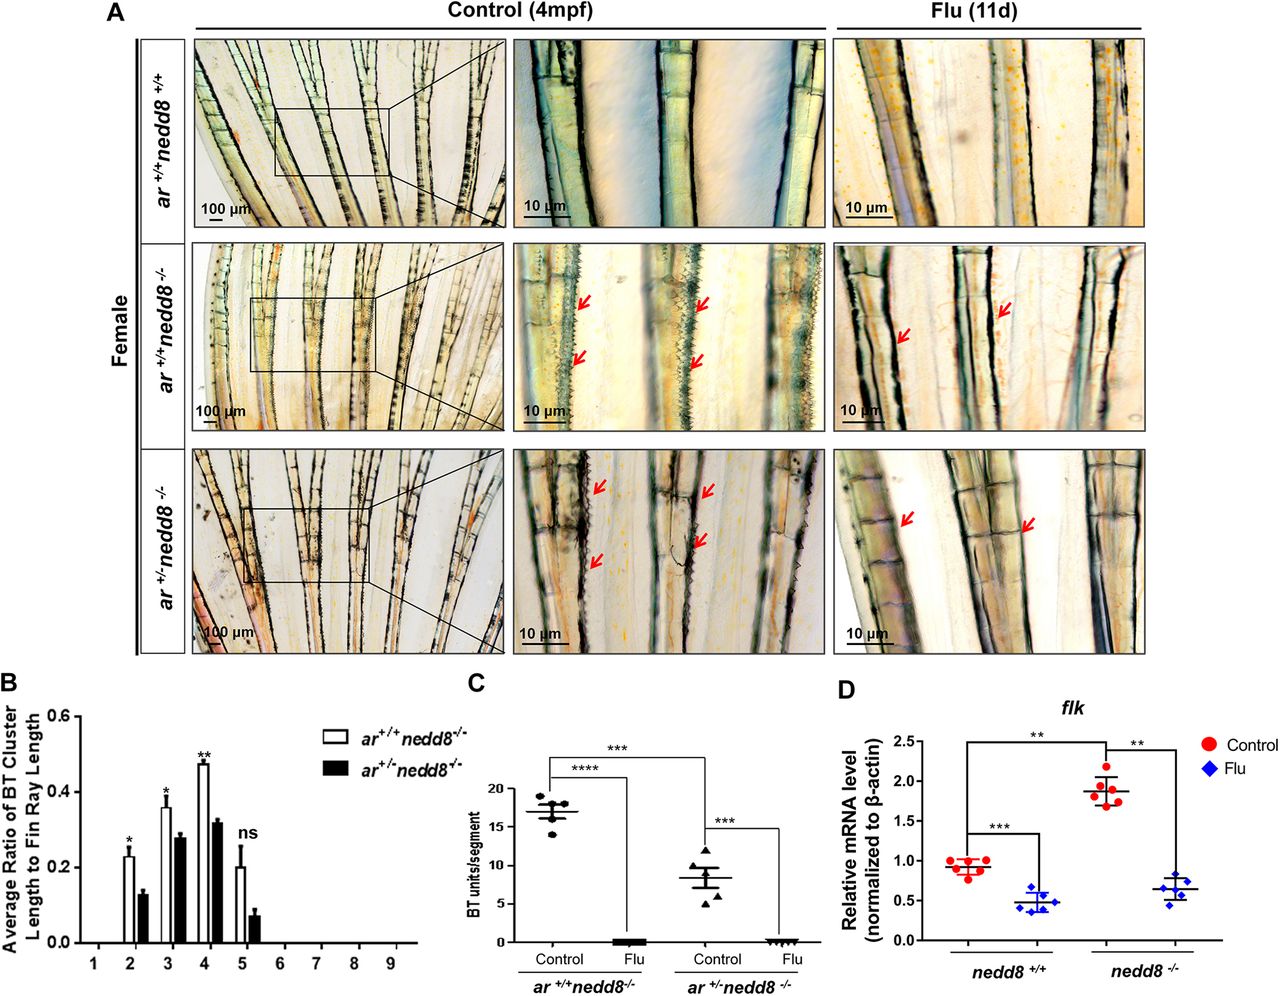
Fig. 3 Loss of ar and/or treatment with the androgen antagonist flutamide eliminates BTs on the pectoral fins of nedd8−/− female zebrafish. (A) Images showing the effects of flutamide (Flu) treatment or ar knockout on the nedd8-knockout-induced BTs on the pectoral fins of female ar+/+nedd8−/− and ar+/−nedd8−/− zebrafish at 4 mpf. The red arrows indicate BTs. Panels on right show magnification of areas indicated by boxed areas on left. (B) Ratio of BT cluster length to pectoral fin ray length in ar+/+nedd8−/− (n=6) and ar+/−nedd8−/− (n=6) female zebrafish (4 mpf), plotted against pectoral fin ray number. (C) BTs/segment in ar+/+nedd8−/− (n=6) and ar+/−nedd8−/− (n=6) female zebrafish (4 mpf), treated with 2 mg/l flutamide for 11 days or untreated (control). (D) flk gene expression in the pectoral fins of nedd8+/+ (n=6) and nedd8−/− (n=6) female zebrafish (4 mpf) treated with 2 mg/l flutamide for 11 days or untreated (control). Gene expression was quantified using quantitative real-time PCR (qPCR). Data are mean±s.e.m. *P<0.05, **P<0.01, ***P<0.001, ****P<0.0001 (unpaired Student's t-test).