FIGURE SUMMARY
Title

P130Cas/bcar1 mediates zebrafish caudal vein plexus angiogenesis

Authors
Wisniewski, L., French, V., Lockwood, N., Valdivia, L.E., Frankel, P.
Source
Full text @ Sci. Rep.

ZFIN is incorporating published figure images and captions as part of an ongoing project. Figures from some publications have not yet been curated, or are not available for display because of copyright restrictions.

EXPRESSION / LABELING:
Antibody:
Fish:
Anatomical Terms:
Stage Range: Prim-5 to Adult
PHENOTYPE:
Fish:
Observed In:
Stage Range: Prim-5 to Adult

ZFIN is incorporating published figure images and captions as part of an ongoing project. Figures from some publications have not yet been curated, or are not available for display because of copyright restrictions.

PHENOTYPE:
Fish:
Observed In:
Stage Range: Day 5 to Adult

ZFIN is incorporating published figure images and captions as part of an ongoing project. Figures from some publications have not yet been curated, or are not available for display because of copyright restrictions.

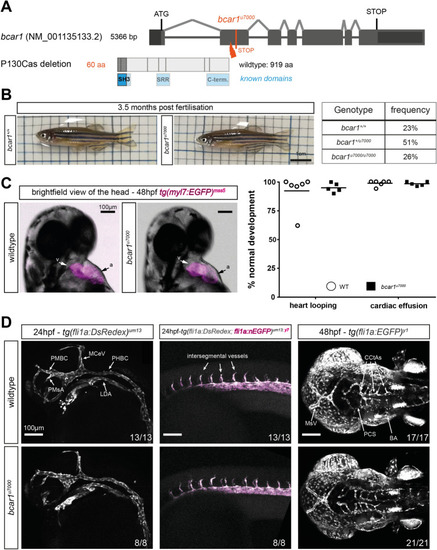
Loss of P130Cas does not induce lethality, major morphological defects, or defects in early arterial angiogenesis in zebrafish. (A) Schematic showing the exon–intron structure of bcar1 and location of the genetic insertion-deletion of bcar1u7000 resulting in protein truncation during translation, known protein domains are indicated in blue. (B) Photographs of live adults (left) and diagramme showing actual observed viability from a bcar1u7000/+ heterozygous incross (right). Homozygous deleted fish are observed with expected Mendelian frequency; morphologically, they appear indistinguishable from wildtype siblings. (C) Brightfield image with fluorescent overlay of tg(myl7:EGFP)mss5 zebrafish hearts at 48hpf (left), clearly showing ventricle (v) and atrium (a). Quantification of n = 6 wildtype and n = 5 bcar1u7000 clutches with n ≥ 53 embryos each (right) confirm the absence of heart looping or effusion (oedema) defects at 48hpf. (D) Maximum intensity projections, lateral views of the head (left column) and trunk (middle column) at 24hpf shows emergence of primordial midbrain channel (PMBC), middle cerebral vein (MCeV), primordial hindbrain channel (PHBC), lateral dorsal aorta (LDA), primitive mesencephalic artery (PMsA), and intersegmental vessel sprouting as normal in bcar1u7000 mutants. Dorsal to ventral view shows emergence of cerebral central arteries (CCtAs), basilar artery (BA) and posterior communicating segment (PCS) by 48hpf as normal (right column). Experimental n as indicated per image, from ≥ 2 independent clutches. Scale bars as indicated.

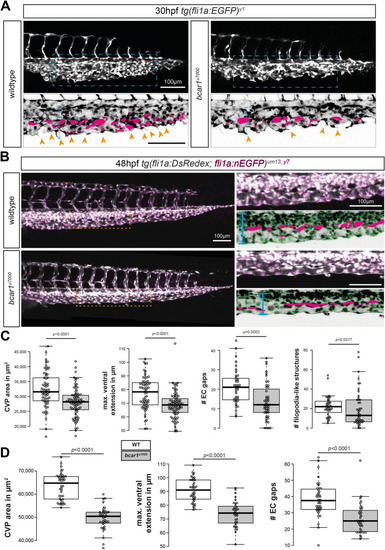
P130Cas is required for caudal vein plexus (CVP) angiogenesis. (A,B) Maximum intensity projections of wildtype and bcar1u7000 embryos at 30hpf (A) and 48hpf (B), with inset (blue/orange dashed boxes) showing the sprouting front. Insets are inverted for easier visualisation. Blue line indicates ventral extension, magenta circles endothelial cell gaps, orange arrowheads filopodia-like cell protrusions. (C,D) Quantification of total CVP area, maximal ventral extension, and total non-vascularised area (= ‘EC gaps’) show a significant reduction at both time points. All results displayed as box plots with centre line showing median and box dimensions indicating 25th and 75th quartile. Each data point represents an individual embryo, experimental n from ≥ 3 independent clutches, p values as shown. White boxes are WT, light grey boxes indicate bcar1u7000. Scale bars as indicated.

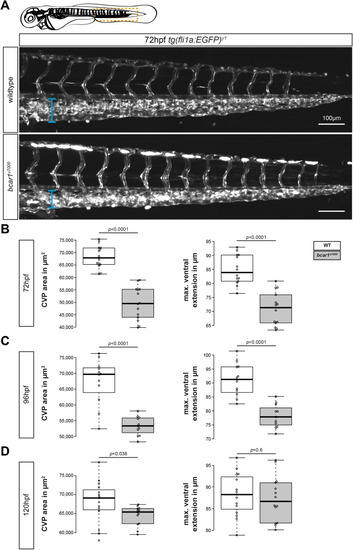
P130Cas deletion results in prolonged reduction of caudal vein plexus area. (A) Maximum intensity projections of the caudal vasculature of WT and bcar1u7000 embryos at 72hpf, from the anal pore, as illustrated by orange box in cartoon of embryo at the top. (B–D) Quantification of the maximum ventral extension of the CVP to the dorsal aorta, as well as overall vascular CVP area confirm that significant reductions remain in mutant embryos at 3dpf (B) and 4dpf (C). At 5dpf, the caudal area is still smaller but the ventral extension no longer significantly different (D). All results displayed as box plots with centre line showing median and box dimensions indicating 25th and 75th quartile. Each data point represents an individual embryo, experimental n from ≥ 2 independent clutches, p values as shown. White boxes are wildtype, light grey boxes indicate bcar1u7000. Scale bar as indicated.

PHENOTYPE:
Fish:
Observed In:
Stage Range: Protruding-mouth to Day 5

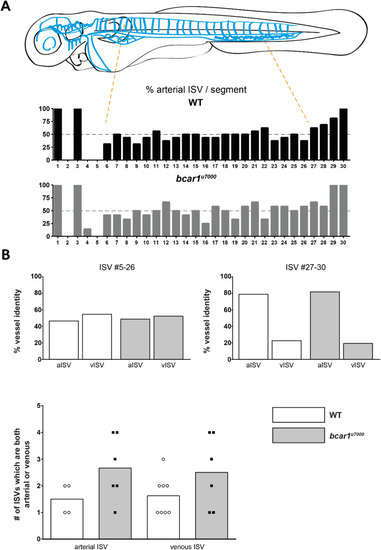
P130Cas is not required for venous intersegmental vessel formation at 72hpf. (A) Illustration showing the vasculature of the trunk in a stylised embryo, with bright blue symbolising arteries and dark blue veins. Bar graphs showing the percentage of ISVs which were arterial for wildtype (black) and bcar1u7000 (grey), from anterior to posterior. (B) Quantification of vessel identity for ISV pairs 5–26 ( left) or the last, more arterial, pairs 27–30 (right) did not show differences. A non-significant increase in the number of ISVs where both vessels were arterial or venous (bottom graph) was observed. White boxes indicate wildtype, grey boxes bcar1u7000.

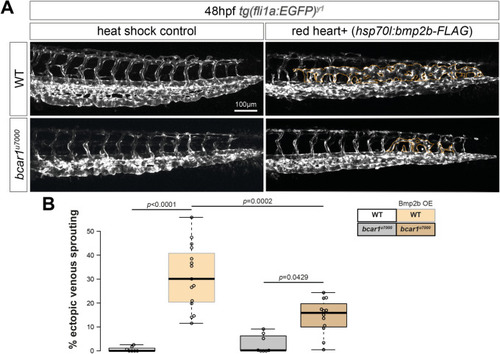
P130Cas mediates Bmp2b-induced formation of ectopic vessels. (A) Maximum intensity projections of WT and bcar1u7000 embryos, injected with hsp70-bmp2b plasmid and tol2 transposase RNA and subjected to heat shock from 22 to 24hpf. Ectopic venous sprouting above the dorsal aorta (indicated by dotted orange lines) is induced by overexpression of Bmp2b (upper row). (B) Quantification showed a 50% reduction of ectopic sprouting in bcar1u7000 embryos (lower row). Data displayed as box plots with centre line showing median and box dimensions indicating 25th and 75th quartile. Each data point represents an individual embryo, experimental n from ≥ 3 independent experiments, p values as shown. White box indicates wildtype, orange box bcar1u7000 embryos, grey shaded boxes indicate hsp70-bmp2b plasmid integration. Scale bar as indicated.

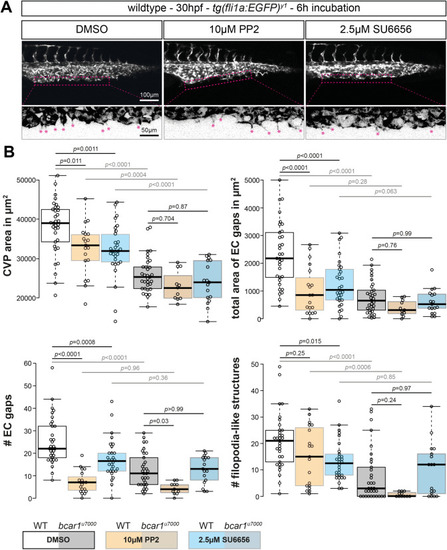
Src family kinases are required for caudal vein plexus formation. (A) Maximum intensity projections of wildtype embryos at 30hpf, exposed to DMSO control, PP2, or SU6656 inhibitors. Inhibition of Src family kinases caused defective CVP sprouting. Magenta dashed lines indicate the area of vascular front, shown below at higher magnification. Areas were inverted and contrast increased in FIJI for better visualisation. Magenta asterisks highlight filopodia-like protrusions. (B) Quantification of CVP area, number of endothelial gaps, total area of endothelial gaps, and number of filopodia-like cell protrusions showed significant reductions after inhibitor but not DMSO treatment. All results displayed as box plots with centre line showing median and box dimensions indicating 25th and 75th quartile. Each data point represents an individual embryo, experimental n from ≥ 3 independent experiments except for bcar1u7000 PP2 which is n = 1, p values as shown. Scale bars as indicated.

Acknowledgments
This image is the copyrighted work of the attributed author or publisher, and ZFIN has permission only to display this image to its users. Additional permissions should be obtained from the applicable author or publisher of the image. Full text @ Sci. Rep.