
- Title
-
Piezo1-Mediated Ca2+ Activities Regulate Brain Vascular Pathfinding during Development
- Authors
- Liu, T.T., Du, X.F., Zhang, B.B., Zi, H.X., Yan, Y., Yin, J.A., Hou, H., Gu, S.Y., Chen, Q., Du, J.L.
- Source
- Full text @ Neuron
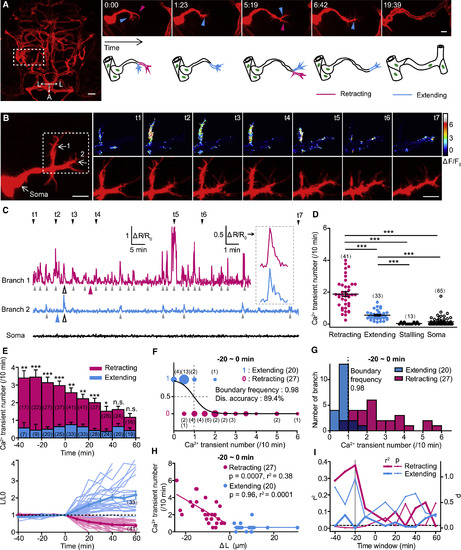
Frequencies of Local Ca2+ Transients at Primary Branches of Endothelial Tip Cells Are Correlated with the Fates of Branch Retraction and Extension (A) Example showing the pathfinding of endothelial tip cells (ETCs) during brain vascular development of zebrafish. Left: projection image of the brain vasculature is shown; right: the pathfinding process for the ETC outlined in the left image is shown. A, anterior; L, lateral. (B) Representative images showing simultaneous calcium and morphology imaging of an ETC with two primary branches. Left and right bottom: mCherry signal is shown; right top: color-coded GCaMP5 signal is shown. (C) Traces of Ca2+ activities of the two branches and soma of the ETC shown in (B). Inset: enlarged Ca2+ transients from left traces (open arrowheads) are shown. Color arrowhead, time point when branch retraction or extension happened; gray arrowhead, Ca2+ transient. (D) Summary of the mean number of Ca2+ transients at the retracting, extending, and stalling branches or soma of ETCs. (E) Time course of the mean Ca2+ transient number (top) and relative length (L/L0, bottom) of retracting and extending ETC branches. The length of the branch measured at the time zero is defined as L0. The light lines represent individual cases, and the heavy lines indicate the average. (F) Logistic regression analysis of the relationship between the frequency of local Ca2+ transients and the fate of ETC branches. The size of the color dots is proportional to the number of events occurred. Dis., discrimination. (G) Distribution of the frequencies of Ca2+ transients at retracting or extending ETC branches. The dashed line indicates the boundary frequency of Ca2+ activities calculated in (F). Dark blue bars indicate the overlapped distribution. (H) Correlation between the frequency of local Ca2+ transients and the length change (ΔL) of ETC branches. (I) Summary of the correlation analysis for both the p and r2 at different time windows. The dashed horizontal line indicates the p value of 0.05. The gray vertical line indicates the data shown in (H). The numbers in the brackets indicate the numbers of ETC branches (D–H) or somata (D) examined. Scale bars, 30 μm in left (A) and 10 μm in right (A) and 10 μm in left and right (B). n.s., no significance; ∗p < 0.05; ∗∗p < 0.01; ∗∗∗p < 0.001 (two-tailed Mann-Whitney test for D; unpaired two-tailed Student’s t test for E). Mean ± SEM. See also Figures S1–S4. |
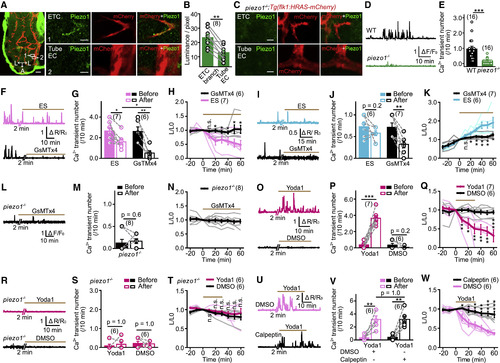
Piezo1 Is Required for Local Ca2+ Transients and Retraction/Extension of ETC Branches (A) Representative images of Piezo1 immunostaining in the brain of a 3-dpf Tg(kdrl:HRAS-mcherry) larval zebrafish. (Left) Projection image of the brain is shown. (Right) Enlarged images (single optical section) outlined in the left are shown. Tube EC, EC located at a vessel tube. Green signals around the brain (left) are due to non-specific staining of the skin. Scale bars, 40 μm (left) and 5 μm (right). (B) Summary of the relative density of Piezo1 signal at ETC branches and nearby Tube EC. The data were from 8 pairs of ETCs and nearby tube ECs in 5 larvae. (C) Representative immunostaining of Piezo1 in a 3-dpf piezo1−/−;Tg(kdrl:HRAS-mcherry) larva. Scale bars, 5 μm. (D and E) Examples and summary showing local Ca2+ activities of ETC branches in Tg(kdrl:GCaMP5) larvae with WT or piezo1−/− background. The data were from 16 ETCs in 9 WT siblings and 16 ETCs in 7 piezo1−/− larvae. (F–H) Effects of GsMTx4-mediated Piezo1 blockade on relatively high frequency local Ca2+ activities and morphological changes of ETC branches. (I–K) Effects of GsMTx4-mediated Piezo1 blockade on relatively low frequency local Ca2+ activities and morphological changes of ETC branches. (L–N) Effect of GsMTx4 application on ETC branches in piezo1−/− larvae. (O–Q) Effects of Yoda1-induced Piezo1 activation on local Ca2+ activities and morphological dynamics of ETC branches. (R–T) Effect of Yoda1 application on ETC branches in piezo1−/− larvae. (U–W) Effects of calpeptin-mediated calpain blockade on Yoda1-induced Ca2+ activities and morphological changes of ETC branches. ∗p < 0.05; ∗∗p < 0.01; ∗∗∗p < 0.001 (paired two-tailed Student’s t test for B and M and intra-group comparison in G, J, P, and V; unpaired two-tailed Student’s t test for H, K, Q, T, and W and inter-group comparison in G and V; two-tailed Wilcoxon signed rank test for intra-group data comparison in S and two-tailed Mann-Whitney test for E). Mean ± SEM. See also Figure S5. EXPRESSION / LABELING:
PHENOTYPE:
|

ZFIN is incorporating published figure images and captions as part of an ongoing project. Figures from some publications have not yet been curated, or are not available for display because of copyright restrictions. PHENOTYPE:
|
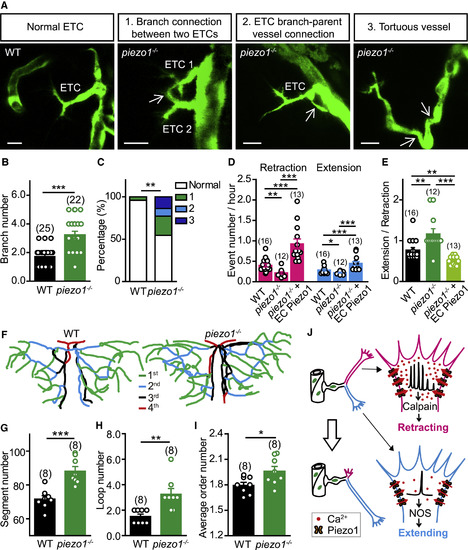
Zebrafish piezo1 Mutation Impairs ETC Pathfinding and Brain Vascular Patterning (A) Images of ETC morphology in 3-dpf Tg(kdrl:eGFP) larvae with WT or piezo1−/− background. The white arrows indicate abnormal connections. Scale bars, 10 μm. (B) Summary of the branch number of ETCs in WT siblings and piezo1−/− larvae. (C) Percentages of normal and abnormal morphologies of ETCs and vessels. WT, from 25 ETCs in 12 larvae; piezo1−/−, from 22 ETCs in 8 larvae. (D and E) Summary of the retraction and extension (D) and extending/retracting ratio (E) of ETC branches in WT, piezo1−/−, and piezo1−/−+EC Piezo1. WT siblings, from 16 ETCs in 9 larvae; piezo1−/−, from 12 ETCs in 6 larvae; piezo1−/−+EC Piezo1, from 13 ETCs in 7 larvae. (F–I) Representative skeletons (F) and summary for the vessel segment number (G), internal vessel loop number (H), and average order number of vessel segments (I) of the midbrain vasculature in WT siblings and piezo1−/− larvae at 7 dpf. The numbers in the brackets represent the numbers of larvae examined. (J) Working model. The same datasets were used in (B) and (C) or in (D) and (E). ∗p < 0.05; ∗∗p < 0.01; ∗∗∗p < 0.001 (two-tailed Mann-Whitney test for B, E, and H; Fisher exact test for C; and unpaired two-tailed Student’s t test for D, G, and I). Mean ± SEM. See also Figure S6. PHENOTYPE:
|