
|
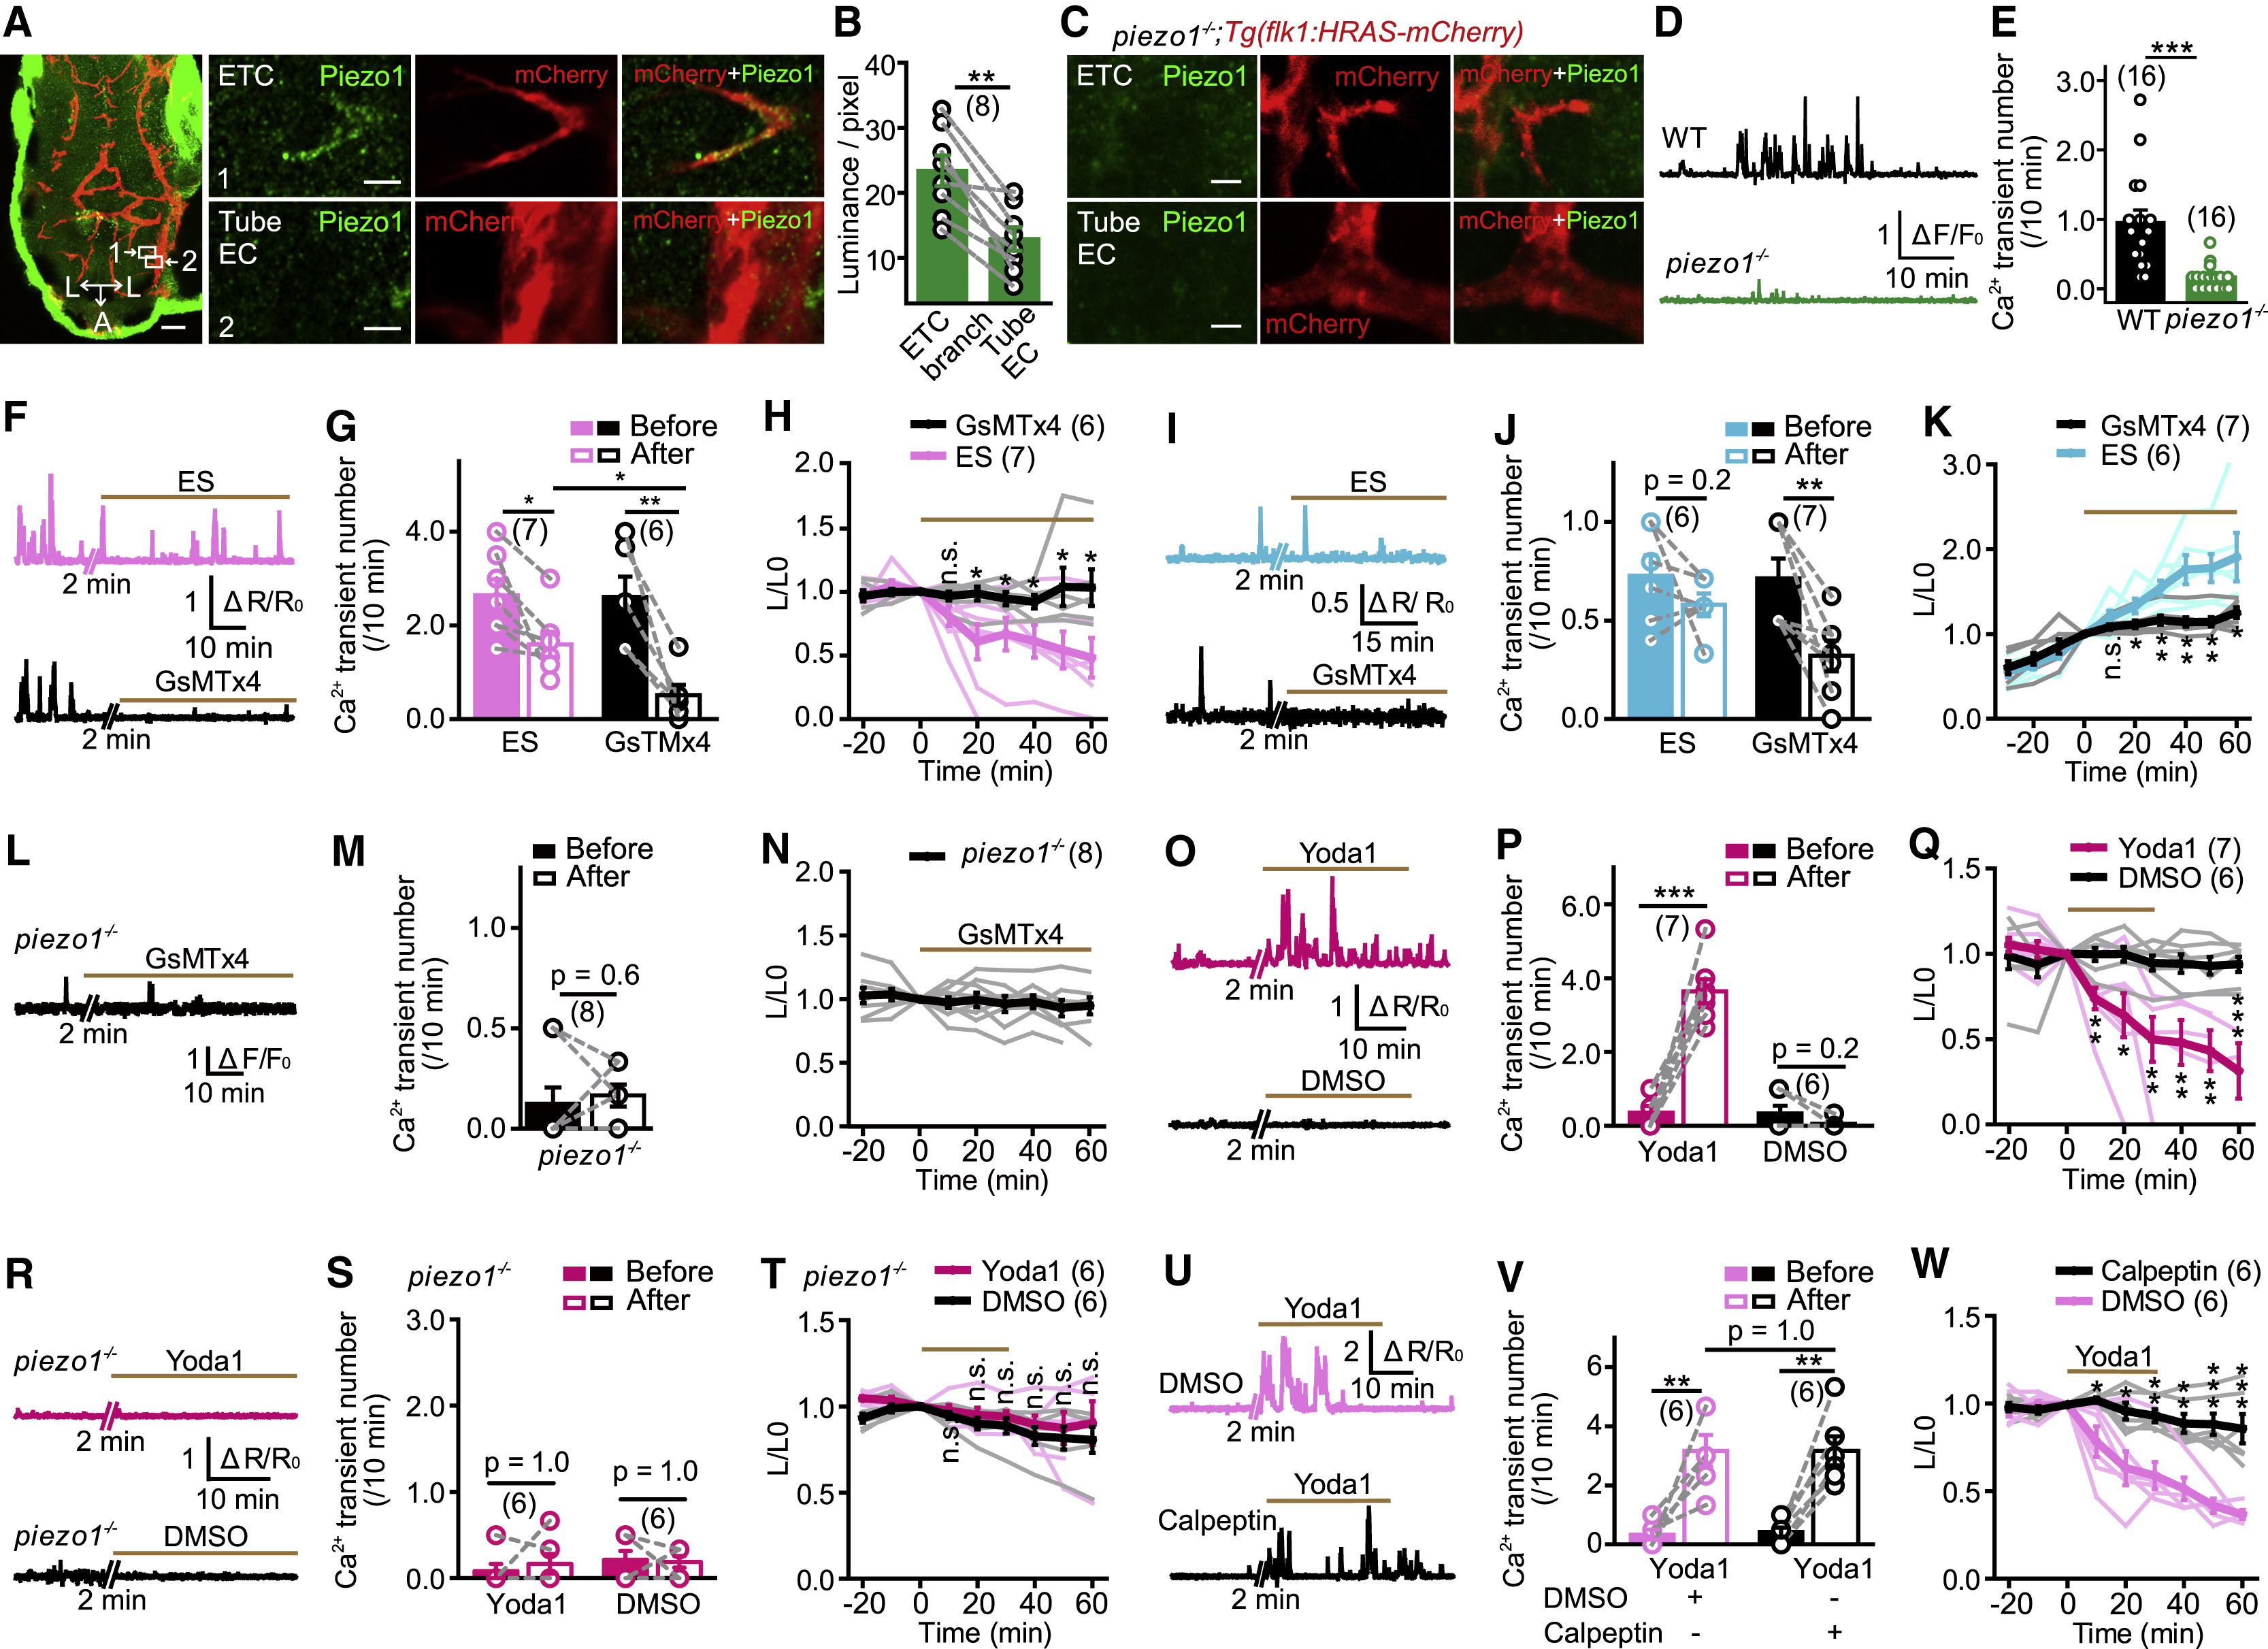
Fig. 4 Piezo1 Is Required for Local Ca2+ Transients and Retraction/Extension of ETC Branches (A) Representative images of Piezo1 immunostaining in the brain of a 3-dpf Tg(kdrl:HRAS-mcherry) larval zebrafish. (Left) Projection image of the brain is shown. (Right) Enlarged images (single optical section) outlined in the left are shown. Tube EC, EC located at a vessel tube. Green signals around the brain (left) are due to non-specific staining of the skin. Scale bars, 40 μm (left) and 5 μm (right). (B) Summary of the relative density of Piezo1 signal at ETC branches and nearby Tube EC. The data were from 8 pairs of ETCs and nearby tube ECs in 5 larvae. (C) Representative immunostaining of Piezo1 in a 3-dpf piezo1−/−;Tg(kdrl:HRAS-mcherry) larva. Scale bars, 5 μm. (D and E) Examples and summary showing local Ca2+ activities of ETC branches in Tg(kdrl:GCaMP5) larvae with WT or piezo1−/− background. The data were from 16 ETCs in 9 WT siblings and 16 ETCs in 7 piezo1−/− larvae. (F–H) Effects of GsMTx4-mediated Piezo1 blockade on relatively high frequency local Ca2+ activities and morphological changes of ETC branches. (I–K) Effects of GsMTx4-mediated Piezo1 blockade on relatively low frequency local Ca2+ activities and morphological changes of ETC branches. (L–N) Effect of GsMTx4 application on ETC branches in piezo1−/− larvae. (O–Q) Effects of Yoda1-induced Piezo1 activation on local Ca2+ activities and morphological dynamics of ETC branches. (R–T) Effect of Yoda1 application on ETC branches in piezo1−/− larvae. (U–W) Effects of calpeptin-mediated calpain blockade on Yoda1-induced Ca2+ activities and morphological changes of ETC branches. ∗p < 0.05; ∗∗p < 0.01; ∗∗∗p < 0.001 (paired two-tailed Student’s t test for B and M and intra-group comparison in G, J, P, and V; unpaired two-tailed Student’s t test for H, K, Q, T, and W and inter-group comparison in G and V; two-tailed Wilcoxon signed rank test for intra-group data comparison in S and two-tailed Mann-Whitney test for E). Mean ± SEM. See also Figure S5.