FIGURE SUMMARY
Title

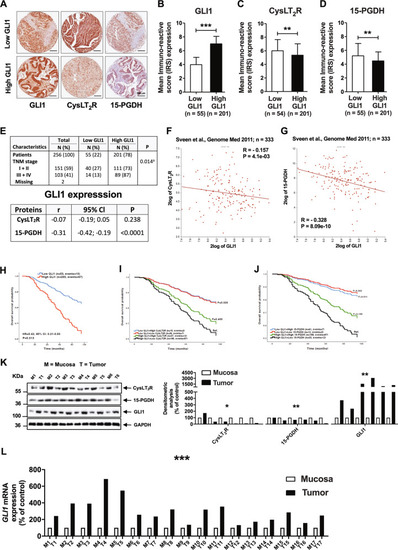
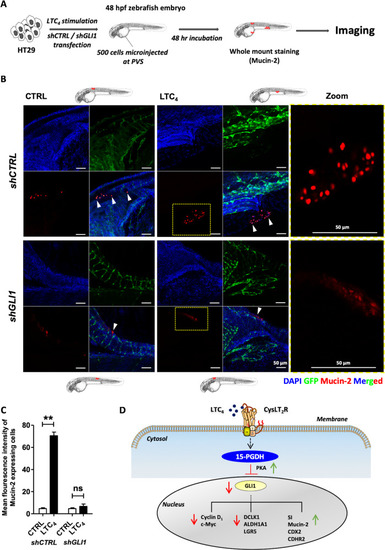
Tumour suppressor 15-hydroxyprostaglandin dehydrogenase induces differentiation in colon cancer via GLI1 inhibition

Authors
Satapathy, S.R., Topi, G., Osman, J., Hellman, K., Ek, F., Olsson, R., Sime, W., Mehdawi, L.M., Sjölander, A.
Source
Full text @ Oncogenesis

GLI1 expression exhibited a negative correlation with CysLT<sub>2</sub>R and 15-PGDH expression in colorectal cancer patient tissues.

a Matched pair immunohistochemistry (IHC) images of GLI1, CysLT2R, and 15-PGDH expression in patients with low- and high-GLI1 expression, shown at ×20 magnification. The staining immunoreactivity was quantified by the mean immunoreactive score (IRS), calculated according to the following formula: IRS = (staining intensity) × (% of stained cells). The mean IRS for the groups of patients with low- and high-GLI1 expression. b The Y-axis represents IRS for GLI1 in these patients. c CysLT2R and d 15-PGDH expression according to patients with low- and high-GLI1 expression in CRC tissue. e Distribution of tumour-node-metastasis (TNM) stages of CRC according to low- and high-GLI1 expression. Pairwise Pearson correlation coefficient (r) between the expression of GLI1 and that of CysLT2R and 15-PGDH. P value according to chi-square test. XY-scatter plots showing mRNA levels of fGLI1 and CysLT2R and gGLI1 and 15-PGDH (HPGD) gene expression from a public database containing 333 CRC patients. Kaplan–Meier curves for overall survival adjusted for age and TNM stage for patients with h low- and high-GLI1 expression and subgroups of patients with both GLI1 and i CysLT2R or j 15-PGDH expression compared by the log-rank test. The last patient group served as the reference category. k Western blot analysis showing the protein expression of CysLT2R, 15-PGDH and GLI1 in matched pairs of six patients with normal (N) and tumour (T) areas. KDa indicated on the left side of the immunoblots (KDa 55, 36, 100, 36) represents protein size markers. Graphical representation of the densitometric analysis showing the relative protein expression for CysLT2R, 15-PGDH, and GLI1 in matched pairs of patient samples (n = 6) from normal mucosa (M, white) and tumour (T, black) areas. l qRT-PCR analysis of GLI1 in matched pairs of normal mucosa (M, white) and tumour (T, black) tissues from CRC patients (n = 17). Scale bar as indicated in the images. Data represent the mean ± SD, *P < 0.05, **P < 0.01, ***P < 0.001, Mann–Whitney test.

GLI1 expression was negatively correlated with differentiation.

a qRT-PCR analysis of MUCIN-2 in matched pairs of normal mucosa (M, white) and tumour (T, black) tissues from CRC patients (n = 17). b Immunohistochemistry (IHC) images for GLI1 and Mucin-2 expression in matched paired tissue samples from colorectal cancer (CRC) patients with low- and high-GLI1 expression represented at ×20 magnification. c Quantification of the staining immunoreactivity by the mean IRS for Mucin-2 expression according to patients with low- and high-GLI1 expression in CRC tissue. d Distribution of tumour type, mucinous adenocarcinomas versus non-mucinous adenocarcinomas, according to low- and high-GLI1 expression. Pairwise Pearson correlation coefficient (r) between the expression of GLI1 and Mucin-2. P value according to chi-square test. e Kaplan–Meier curves for overall survival adjusted for age and TNM stage subgroups of patients with both GLI1 and Mucin-2 expression compared by the log-rank test. The high-GLI1 and low-Mucin-2 patient group was set as the reference category. f Experimental schematic of the AOM–DSS mouse model. GLI1 expression exhibited a negative correlation with differentiation in the cysltr2−/− AOM–DSS mouse model. Immunohistochemical evaluation showing the protein expression of g Mucin-2 and h GLI1 in wt and cysltr2−/− AOM–DSS-challenged mice. Graph bars showing the IRS scores for Mucin-2 and GLI1, respectively, compared between wt and cysltr2−/−, n = 6 mice/group. Scale bar as indicated in the images. Data represent the mean ± SD, ***P < 0.001, Mann–Whitney test.

15-PGDH regulates the LTC<sub>4</sub>-mediated downregulation of Hh–GLI signalling in colon cancer cells.

a qRT-PCR analysis of GLI1 mRNA expression in HT-29 and Caco-2 cells with or without LTC4 stimulation for 48 h. b Western blot analysis of 15-PGDH, GLI1, and phospho-PKA (αβγ subunit and β subunit) levels in HT-29 and Caco-2 cells with or without LTC4 stimulation. α-Tubulin served as the loading control. c Immunofluorescence analysis of GLI1 in HT-29 cells with or without LTC4 stimulation for 48 h. d qRT-PCR analysis of HT-29 cells transfected with control shRNA (shCTRL) or PGDH-specific shRNA (shHPGD) with or without LTC4 stimulation for 48 h. e Western blot analysis of HT-29 cells transfected with control shRNA (shCTRL) or PGDH-specific shRNA (shHPGD) blotted with antibodies against 15-PGDH, GLI1, or phospho-PKA (αβγ subunit and β subunit) with or without LTC4 stimulation for 48 h. α-Tubulin served as the loading control. f Immunofluorescence analysis of GLI1 in HT-29 cells transfected with control shRNA (shCTRL) or PGDH-specific shRNA (shHPGD) with or without LTC4 stimulation for 48 h. g qRT-PCR analysis of 15-PGDH and GLI1 in HT-29 cells treated with the PKA inhibitor H89 (PKA-inh) for 6 h followed by LTC4 for 48 h. h Western blot analysis showing the expression of 15-PGDH, GLI1, and phospho-PKA (αβγ subunit and β subunit) in HT-29 cells treated with the PKA inhibitor H89 (PKA-inh) for 6 h followed by LTC4 for 48 h. i Immunofluorescence analysis of GLI1 in HT-29 cells treated with the PKA inhibitor H89 (PKA-inh) for 6 h followed by LTC4 for 48 h. HPRT1 was used as the housekeeping gene for normalisation of the qRT-PCR gene expression data. Graphs represent the mean ± SEM of data from 3 to 4 independent experiments, **P < 0.01, ***P < 0.001.

15-PGDH promotes differentiation in colon cancer via GLI1.

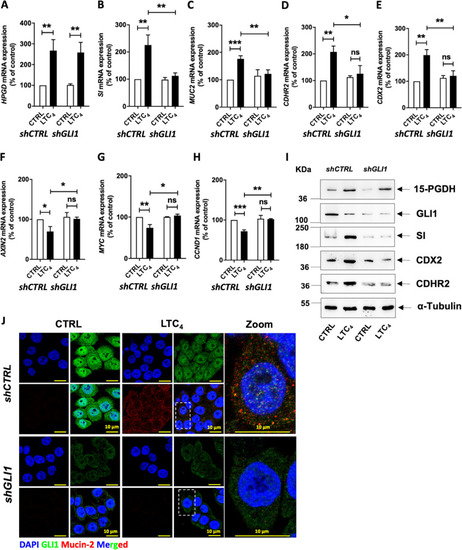
qRT-PCR validation of gene expression in shCTRL (control shRNA)- or shGLI1 (GLI1-specific shRNA)-transfected HT-29 cells with or without LTC4 stimulation for 48 h. Marker of tumour suppression in a15-PGDH. Markers of differentiation in bSI, in cMUCIN-2, and in dCDHR2. Marker of differentiation regulation as in eCDX2. Markers of Wnt activation in fAXIN2 and gcMYC. Marker of proliferation in h (CCND1). HPRT1 was used as the housekeeping gene for normalization of the gene expression data. i Western blot analysis of whole-cell lysates for 15-PGDH, GLI1, SI, CDX2, and CDHR2 expression in shCTRL (control shRNA)- or shGLI1 (GLI1-specific shRNA)-transfected HT-29 cells with or without LTC4 stimulation for 48 h. α-Tubulin served as the loading control. j Immunofluorescence analysis of GLI1 and Mucin-2 in cells with or without LTC4 stimulation for 48 h and transfected with shCTRL or shGLI1. Graphs represent the mean ± SEM of data from three independent experiments, *P < 0.05, **P < 0.01, ***P < 0.001.

GLI1 negatively regulates the differentiation and promotes the proliferation of colon cancer cells in the absence of 15-PGDH.

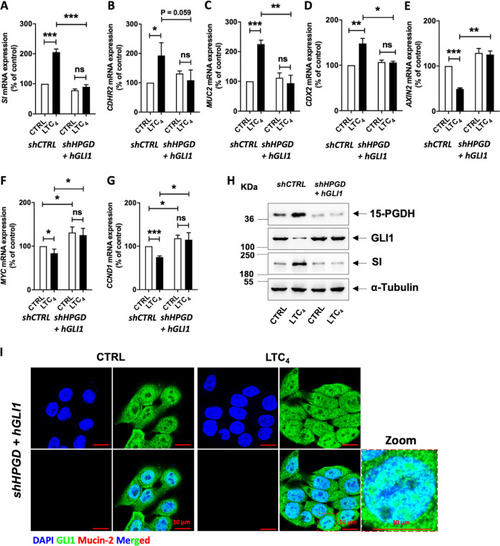
HT-29 cells were either transfected with shCTRL alone or co-transfected with shHPGD and pEGFP-hGLI1 followed by LTC4 stimulation for 48 h. qRT-PCR analysis of the differentiation markers aSI, bMUCIN-2 and cCDHR2, d the differentiation regulation marker CDX2, e the Wnt activation marker AXIN2, f the pro-oncogene cMYC and g the proliferation marker CCND1. h Western blot analysis of whole-cell lysates for 15-PGDH, GLI1, and SI expression. α-Tubulin was used as the loading control. i Immunofluorescence analysis of GLI1 and Mucin-2 in unstimulated or LTC4-stimulated cells transfected with shHPGD or shGLI1. HPRT1 was used as the housekeeping gene for normalization of the qRT-PCR gene expression data. Graphs represent data from 3 to 4 independent experiments and represent the mean ± SEM, *P < 0.05, **P < 0.01, ***P < 0.001.

LTC<sub>4</sub>-induced 15-PGDH expression negatively regulates GLI1 via CysLT<sub>2</sub>R.

Graphs showing qRT-PCR analysis of aCYSLTR2, b15-PGDH, and cGLI1 mRNA expression in HCT-116 cells with stable transfection of doxycycline-regulated shCYSLTR2 cultured with or without doxycycline (1 µM) treatment followed by LTC4 (40 nM) stimulation for 48 h. d Western blot analysis of CysLT2R, 15-PGDH, GLI1, and SI expression in whole-cell lysates. α-Tubulin served as the loading control. e qRT-PCR analysis showing mRNA expression of GLI1 and f western blot analysis of GLI1 protein expression in HT-29 cells stimulated with or without LTC4 and with or without AP100984 (a CysLT2R antagonist). HPRT1 was used as the housekeeping gene, and α-tubulin was used as the loading control in the western blot assay. g Schematic illustration of colonosphere formation. GLI1 regulates the effect of LTC4 on stemness in multicellular colonospheres. The cells were cultured in ultra-low-attachment conditions on matrigel containing serum-free medium for 14 days. h Representative images of colonospheres from HT-29 cells transfected with shCTRL, shHPGD, or shGLI1 and stimulated or not stimulated with LTC4. Bar graphs showing the number of colonospheres formed per well and the size of colonospheres with or without LTC4 stimulation and comparing the shCTRL-, shHPGD-, and shGLI1-transfected groups. qRT-PCR analysis of the stemness markers iDCLK1, jGLI1, and mLGR5 in colonospheres derived from shCTRL-, shHPGD-, or shGLI1-transfected HT-29 cells with or without LTC4 stimulation for 48 h. k Western blot analysis showing the expression of DCLK1, 15-PGDH, and GLI1 in transfected HT-29 cells as indicated. α-Tubulin served as the loading control. qRT-PCR analysis of lDCLK1 and nLGR5 in matched pairs of mucosa (M) and tumour (T) tissues from CRC patients (n = 17). HPRT1 was used as the housekeeping gene for normalization of the qRT-PCR gene expression data. Data represent the mean ± SEM from 4 to 5 independent experiments, *P < 0.05, **P < 0.01, ***P < 0.001.

LTC<sub>4</sub>-induced 15-PGDH promotes differentiation in transgenic zebrafish xenografts.

a Schematic diagram showing the experimental setup of HT-29 cell-based xenografts in transgenic zebrafish (n = 20 in each group). b Immunofluorescence analysis of whole-mount staining of xenografted transgenic zebrafish Tg(fli1:EGFP) embryos with anti-Mucin-2 antibodies after the injection of shCTRL- or shGLI1-transfected HT-29 cells with or without LTC4 stimulation into the perivitelline space (PVS)53. c Graphical representation of the mean fluorescent intensity of Mucin-2-expressing HT-29 colon cancer cells transfected with shCTRL or shGLI1 with or without LTC4 stimulation. The scale bars are as indicated in the images. d Schematic mechanistic model described in the study. Mean ± SEM, **P < 0.01.

Acknowledgments
This image is the copyrighted work of the attributed author or publisher, and ZFIN has permission only to display this image to its users. Additional permissions should be obtained from the applicable author or publisher of the image. Full text @ Oncogenesis