IMAGE

Fig. 2

ID
ZDB-IMAGE-200829-7
Source
Figures for Satapathy et al., 2020
Image
Figure Caption

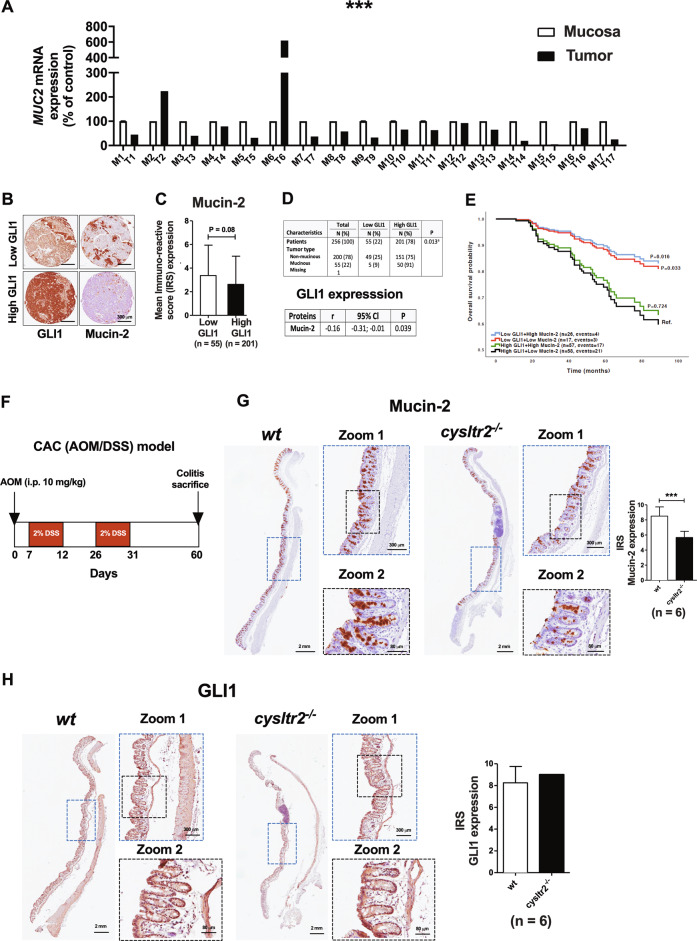
Fig. 2 GLI1 expression was negatively correlated with differentiation.

a qRT-PCR analysis of MUCIN-2 in matched pairs of normal mucosa (M, white) and tumour (T, black) tissues from CRC patients (n = 17). b Immunohistochemistry (IHC) images for GLI1 and Mucin-2 expression in matched paired tissue samples from colorectal cancer (CRC) patients with low- and high-GLI1 expression represented at ×20 magnification. c Quantification of the staining immunoreactivity by the mean IRS for Mucin-2 expression according to patients with low- and high-GLI1 expression in CRC tissue. d Distribution of tumour type, mucinous adenocarcinomas versus non-mucinous adenocarcinomas, according to low- and high-GLI1 expression. Pairwise Pearson correlation coefficient (r) between the expression of GLI1 and Mucin-2. P value according to chi-square test. e Kaplan–Meier curves for overall survival adjusted for age and TNM stage subgroups of patients with both GLI1 and Mucin-2 expression compared by the log-rank test. The high-GLI1 and low-Mucin-2 patient group was set as the reference category. f Experimental schematic of the AOM–DSS mouse model. GLI1 expression exhibited a negative correlation with differentiation in the cysltr2−/− AOM–DSS mouse model. Immunohistochemical evaluation showing the protein expression of g Mucin-2 and h GLI1 in wt and cysltr2−/− AOM–DSS-challenged mice. Graph bars showing the IRS scores for Mucin-2 and GLI1, respectively, compared between wt and cysltr2−/−, n = 6 mice/group. Scale bar as indicated in the images. Data represent the mean ± SD, ***P < 0.001, Mann–Whitney test.

Acknowledgments
This image is the copyrighted work of the attributed author or publisher, and ZFIN has permission only to display this image to its users. Additional permissions should be obtained from the applicable author or publisher of the image. Full text @ Oncogenesis