FIGURE SUMMARY
Title

De novo phosphoinositide synthesis in zebrafish is required for triad formation but not essential for myogenesis

Authors
Smith, L., Fabian, L., Al-Maawali, A., Noche, R.R., Dowling, J.J.
Source
Full text @ PLoS One

Development of a CRISPR/Cas9 <italic>cdipt</italic> mutant zebrafish.

A) Schematic representation of phosphoinositide signaling pathway. CDIPT catalyzes the addition of the myo-inositol to the CDP-DAG to generate PI, which is the base precursor for all species of PIPs. B) Schematic representing exon organization of cdipt. Exon 3 was targeted by CRISPR/Cas9 gene editing. C) Sanger sequencing of wildtype (WT) and homozygous cdipt mutant (MUT) larvae showing a 10-bp deletion in exon 3 of cdipt. D) Fold change of mRNA levels between WT and MUT fish at both 3 dpf and 6 dpf. There is a significant change in cdipt mRNA levels between WT and MUT zebrafish at both 3 dpf (0.5-fold reduction; *p = 0.0035) and 6 dpf (0.6-fold reduction; **p = 0.0073). Each replicate is represented by a point, n = 30 per replicate; Student’s t test, 2-tailed. Error bars indicate SEM.

EXPRESSION / LABELING:
Gene:
Fish:
Anatomical Term:
Stage Range: Protruding-mouth to Day 6
PHENOTYPE:
Fish:
Observed In:
Stage Range: Protruding-mouth to Day 6

Characterization of the <italic>cdipt</italic> mutant phenotype at 6dpf.

A)cdipt mutant zebrafish exhibit a gastrointestinal phenotype with a dark, globular and oversized liver (yellow outline) and a small intestine (yellow arrows), abnormal jaw structure (black arrows), tissue degradation around the cloaca (black arrowhead), and defective ventral fin (yellow arrowhead). B) Representative image of cdipt mutants at 6dpf, showing normal birefringence pattern indistinguishable from WT siblings, indicative of normal sarcomere organization. C) Confocal micrographs showing localization by indirect immunofluorescence of actin (upper panels), DHPR (middle panels) and α-actinin (bottom panels) in the skeletal myofibers. There is no noticeable difference in the localization of these proteins between WT (left column) and cdipt mutant (right column). Insets represent high magnification of areas surrounded by white rectangles. Scale bars = 5 μm.

Skeletal muscle ultrastructure.

A-B) Transmission electron micrographs show normal skeletal muscle ultrastructure in cdipt larvae. T-tubules (insets; black arrow) are apposed by terminal cisternae of sarcoplasmic reticulum (insets; white arrow). C) Diagram illustrating triad structure and features used for measurements: A1 = T-tubule area; A2 and A3 = terminal cisternae (TC) areas; D1 = maximum distance between TCs; * = gap width (distance between TC membrane and T-tubule membrane). D) There is no significant difference in the triad area between WT and cdipt mutant larvae (A1+A2+A3 graph) (n = 36, p = 0.9217). The T-tubule area (A1 graph) is qualitatively slightly smaller in the cdipt mutant than in WT (n = 36; P = 0.5246), whereas the distance between cisternae at maximum distance (D1 graph) (n = 36, p < 0.0001) and the gap width (* graph) (n = 44, p < 0.0001) are significantly smaller in cdipt mutants than in WT. Scale bars = 200 nm.

<italic>cdipt</italic> mutants have significantly impaired motor function compared to their wildtype siblings.

A) Spontaneous swim movement was assessed by tracking 5-days or 6-days old zebrafish larvae over 1 hour. Representative examples of tracking plots of individual larvae movement. Black represents slow movement (<5 mm/s), green represents average speed (5–20 mm/s), and red represents fast movement (>20 mm/s). B) The cdipt mutant larvae are significantly slower than their WT siblings, both at 5dpf (WT n = 22, cdipt n = 26, p = 0.0318) and 6dpf (WT n = 36, cdipt n = 28, p = 0.0036). C) Involuntary motor function was assessed using an optovin-stimulated movement assay in response to pulses of light. Representative examples of tracking plots of individual larvae showing movement over 20 seconds, involving 5 seconds of white light exposure followed by 15 seconds of darkness. D) There is a significant difference between the average speed travelled by WT zebrafish compared to cdipt mutant zebrafish (n = 18 and 14, respectively; p < 0.0001, Student’s t test, 2-tailed). WT and cdipt mutant zebrafish plateau at the same rate (n = 7, p = 0.3487).

Localization of PIPs by immunofluorescence in wildtype and <italic>cdipt</italic> mutant zebrafish.

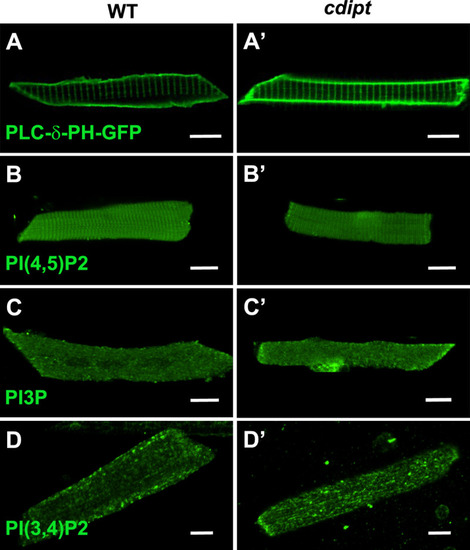
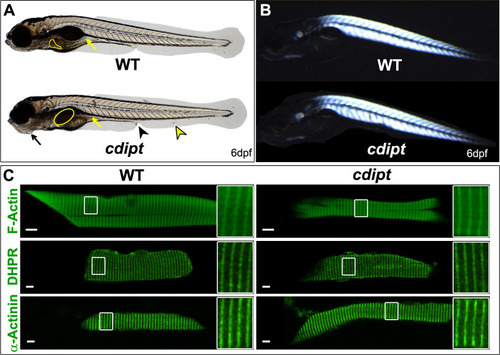
Confocal micrographs showing localization of PIPs is not affected in early larval development of cdipt mutants. (A, A’) visualization of skeletal muscle from live embryos injected with PLCδPH-GFP, a marker for PI(4,5)P2. There was no obvious difference in expression between wild type (WT) and cdipt mutant embryos. (B-D, B’-D’) Immunostaining with PIP antibodies of myofibers isolated from WT and cdipt mutants. Localization of PI(4,5)P2(B, B’), PI3P (C, C’) and PI(3,4)P2(D, D’) is similar in wildtype and cdipt zebrafish. Scale bars = 10μm.

Localization of PIPs by immunoelectron microscopy in wildtype and <italic>cdipt</italic> mutant zebrafish.

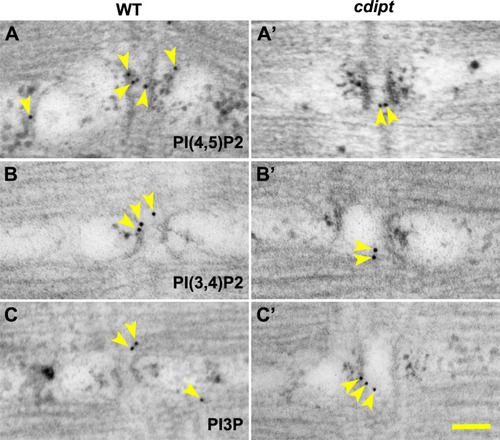
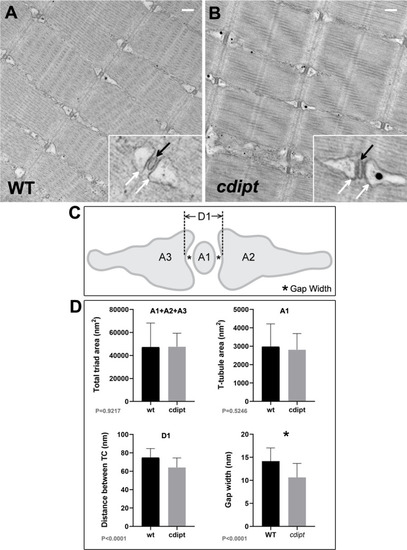
Transmission immunoelectron micrographs showing localization of nanogold-labelled antibodies against (A, A’) PI(4,5)P2, (B, B’) PI(3,4)P2 and PI3P (C, C’) (yellow arrowheads) at the skeletal muscle triad. There is no difference in localization of these antibodies between WT and cdipt mutant embryos. Scale bar = 100nm.

Acknowledgments
This image is the copyrighted work of the attributed author or publisher, and ZFIN has permission only to display this image to its users. Additional permissions should be obtained from the applicable author or publisher of the image. Full text @ PLoS One