IMAGE

Fig 1

ID
ZDB-IMAGE-200822-3
Genes
Source
Figures for Smith et al., 2020
Image
Figure Caption

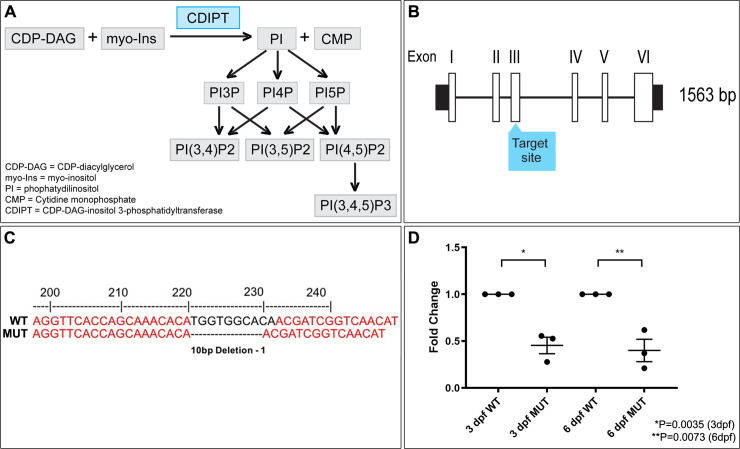
Fig 1 Development of a CRISPR/Cas9 <italic>cdipt</italic> mutant zebrafish.

A) Schematic representation of phosphoinositide signaling pathway. CDIPT catalyzes the addition of the myo-inositol to the CDP-DAG to generate PI, which is the base precursor for all species of PIPs. B) Schematic representing exon organization of cdipt. Exon 3 was targeted by CRISPR/Cas9 gene editing. C) Sanger sequencing of wildtype (WT) and homozygous cdipt mutant (MUT) larvae showing a 10-bp deletion in exon 3 of cdipt. D) Fold change of mRNA levels between WT and MUT fish at both 3 dpf and 6 dpf. There is a significant change in cdipt mRNA levels between WT and MUT zebrafish at both 3 dpf (0.5-fold reduction; *p = 0.0035) and 6 dpf (0.6-fold reduction; **p = 0.0073). Each replicate is represented by a point, n = 30 per replicate; Student’s t test, 2-tailed. Error bars indicate SEM.

Figure Data
Acknowledgments
This image is the copyrighted work of the attributed author or publisher, and ZFIN has permission only to display this image to its users. Additional permissions should be obtained from the applicable author or publisher of the image. Full text @ PLoS One