FIGURE SUMMARY
Title

Translating GWAS-identified loci for cardiac rhythm and rate using an in vivo image- and CRISPR/Cas9-based approach

Authors
von der Heyde, B., Emmanouilidou, A., Mazzaferro, E., Vicenzi, S., Höijer, I., Klingström, T., Jumaa, S., Dethlefsen, O., Snieder, H., de Geus, E., Ameur, A., Ingelsson, E., Allalou, A., Brooke, H.L., den Hoed, M.
Source
Full text @ Sci. Rep.

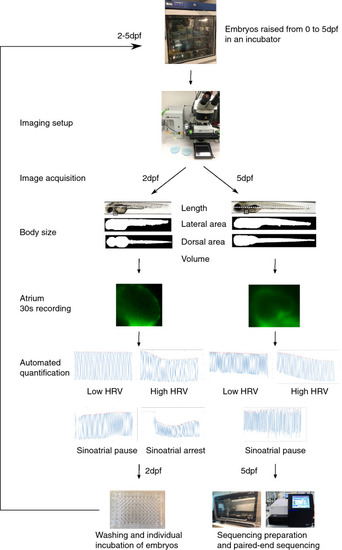
Overview of the experimental pipeline showing the image-based acquisition and post-processing of images and samples. dpf days post-fertilization.

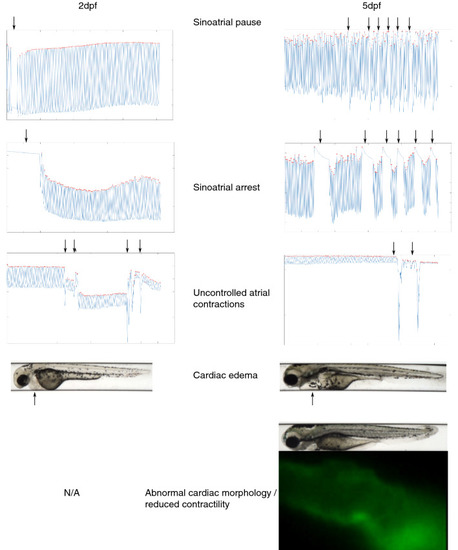
Visualization of cardiac rhythmic or other abnormalities, highlighted by arrows. Sinoatrial pauses were defined as the atrium ceasing to contract for > 3 × the median inter beat interval of the embryo. A sinoatrial arrest was defined as an event where the atrium stopped contracting for > 2 s. Abnormal cardiac morphology was defined as the atrium appearing as a tube-like structure, and impaired cardiac contractility was defined as the atrium vibrating rather than contracting.

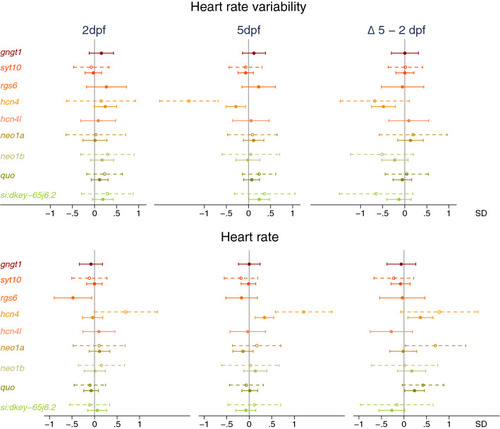
Effect of CRISPR/Cas9-induced mutations in candidate genes on (change in) heart rate variability (top) and heart rate (bottom) at 2 days post-fertilization (dpf, n = 234) and 5dpf (n = 285). Full dots and solid whiskers show the effect size and 95% confidence interval (CI) for each additional mutated allele, weighted by the mutation’s predicted effect on protein function. Open dots and dotted whiskers indicate the effect and 95% CI for nonsense mutations in both alleles vs. no CRISPR/Cas9-induced mutations. Effects were adjusted for the weighted number of mutated alleles in the other targeted genes, as well as for time of day (fixed factors), with embryos nested in batches (random factor). quo and si:dkey-65j6.2 are orthologues of the human KIAA1755.

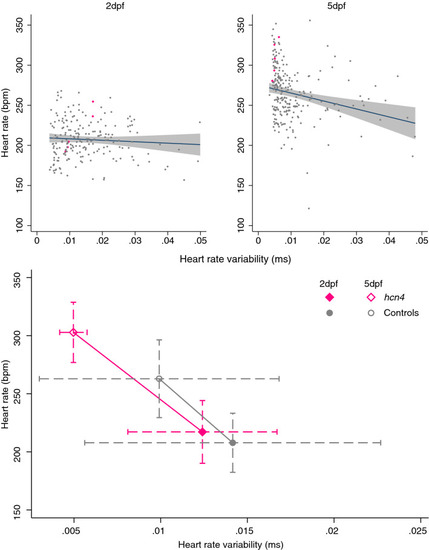
Association of heart rate variability and heart rate at 2- and 5-days post-fertilization (dpf) and effect of nonsense mutations in both hcn4 alleles. Top: the association of heart rate variability and heart rate at 2 and 5dpf, with embryos carrying nonsense mutations in both hcn4 alleles shown as pink diamonds. Bottom: the mean ± standard deviation of heart rate variability and heart rate at 2dpf and 5dpf for embryos with nonsense mutations in both hcn4 alleles (n = 5) vs. embryos without CRISPR/Cas9-induced mutations in hcn4 (n = 147).

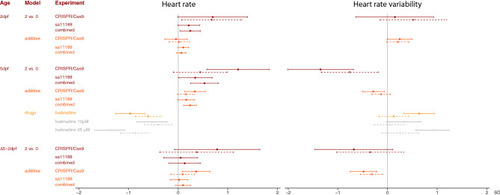
The effect of mutations in hcn4 and treatment with ivabradine on (change in) heart rate variability and heart rate. Effects were examined by comparing embryos with nonsense mutations in both hcn4 alleles and embryos free from CRISPR/Cas9 or sa11188 mutations; as well as using an additive model, weighing the number of mutated alleles by their predicted effect on protein function based on Ensembl’s Variant Effect Predictor (VEP). Effects were adjusted for time of day and the weighted number of mutated alleles in other targeted genes as fixed factors, and with embryos nested in batches and experiment (for the combined analysis, random factor). Dots and whiskers represent effect sizes and 95% confidence intervals.

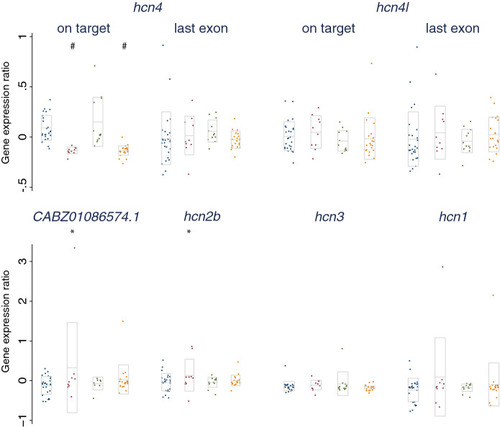
qRT-PCR results for the expression of transcripts with high (> 75%) sequence similarity to the main zebrafish hcn4 transcript, with and without CRISPR/Cas9 targeting of hcn4, hcn4l, or hcn4 & hcn4l. Each sample consists of five pooled, 5-day-old embryos, which at the single cell stage had been injected with: (1) hcn4 and hcn4l gRNAs, or Cas9 mRNA (controls, in blue, n = 26); or with Cas9 mRNA together with (2) hcn4 gRNA (red, n = 10); (3) hcn4l gRNA (green, n = 12); or (4) hcn4 and hcn4l gRNA (orange, n = 21). In all samples, technological triplicates of quantification cycles (Cq) were averaged, and normalized using expression in un-injected controls as calibrator, and expression of mob4 as a reference gene, using the Pfaffl method. For hcn4 and hcn4l, expression was quantified at the CRISPR/Cas9 targeted site and at the last exon. Differences between the three experimental conditions and controls were examined in a multiple linear regression analysis, adjusting for batch (n = 2). CABZ01086574.1 is likely an orthologue of the human HCN2. Significant differences with controls are highlighted by * (p < 0.05) or # (P < 1 × 10–4). Boxes show mean ± 1 SD. Genes are ordered by sequence similarity to the main hcn4 transcript.

Acknowledgments
This image is the copyrighted work of the attributed author or publisher, and ZFIN has permission only to display this image to its users. Additional permissions should be obtained from the applicable author or publisher of the image. Full text @ Sci. Rep.