
Figure 3
- ID
- ZDB-FIG-200723-5
- Publication
- von der Heyde et al., 2020 - Translating GWAS-identified loci for cardiac rhythm and rate using an in vivo image- and CRISPR/Cas9-based approach
- Other Figures
- All Figure Page
- Back to All Figure Page
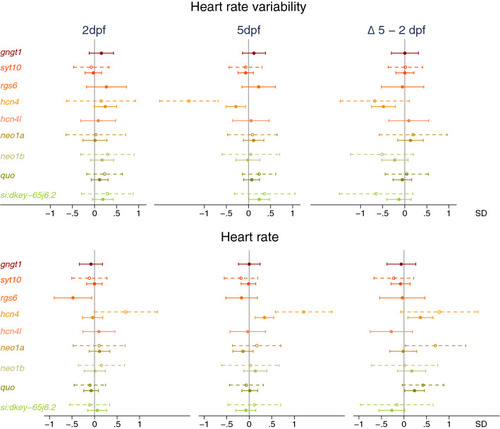
Effect of CRISPR/Cas9-induced mutations in candidate genes on (change in) heart rate variability (top) and heart rate (bottom) at 2 days post-fertilization (dpf, n = 234) and 5dpf (n = 285). Full dots and solid whiskers show the effect size and 95% confidence interval (CI) for each additional mutated allele, weighted by the mutation’s predicted effect on protein function. Open dots and dotted whiskers indicate the effect and 95% CI for nonsense mutations in both alleles vs. no CRISPR/Cas9-induced mutations. Effects were adjusted for the weighted number of mutated alleles in the other targeted genes, as well as for time of day (fixed factors), with embryos nested in batches (random factor). |