
- Title
-
Mechanisms of vascular damage by systemic dissemination of the oral pathogen Porphyromonas gingivalis
- Authors
- Farrugia, C., Stafford, G.P., Potempa, J., Wilkinson, R.N., Chen, Y., Murdoch, C., Widziolek, M.
- Source
- Full text @ FEBS J.
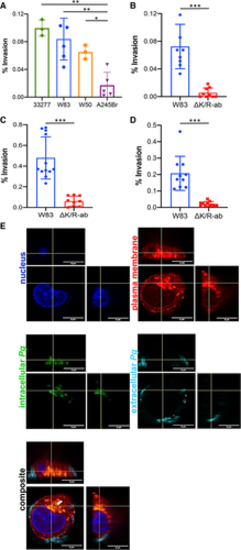
Strain and gingipain‐dependent invasion of Pg into human endothelial cells. HDMEC were infected with wild‐type strain Pg ATCC33277, W83, W50 or A245Br (A) or wild‐type Pg W83 and ∆K/R‐ab (B) at a MOI 100 for 90 min. HMEC‐1 (C) and HCAEC (D) were infected with wild‐type Pg W83 or ∆K/R‐ab mutant also at a MOI 100 for 90 min. Bacterial cell invasion was determined by antibiotic protection assay and expressed as a percentage of primary bacterial inoculum recovered. Graphs show means ± SD (n = at least 3 individual experiments with each individual experiment performed in triplicate technical repeats; shown as filled circles). Data were analysed using one‐way ANOVA with Tukey’s post hoc comparison test (Fig. 1A) or Student's t‐test (Fig 1B‐D), *P < 0.05, **P < 0.01, ***P < 0.001. Representative maximum intensity Z projection images of HMEC‐1 with intracellular (green) and extracellular (cyan) Pg W83. Cell nucleus (blue) and plasma membrane (red). Composite image shows intracellular dwelling Pg as orange (green and red colocalisation, white arrow), and extracellular (cyan) bacteria bound to the cell surface (E). All images show x‐axis, y‐axis and z‐axis planes, and scale bars in images are all 5 μm. |

Pg W83 increases permeability of endothelial cell monolayers in a gingipain‐dependent manner. HDMEC (A–C) or HMEC‐1 (D) cells were grown to confluent monolayers on fibronectin‐coated inserts, infected with Pg at a MOI 1000 for 1.5 h, followed by the measurement of high molecular weight (70 kDa) fluorescein dextran passing through the monolayer barrier. Morphology of HDMEC monolayer in the absence (−Pg) or presence (+Pg) of W83 (A); white arrows indicate areas of cell attachment loss (scale bar in A = 20 μm). In vitro permeability assay of HDMEC in the absence (−Pg) or presence (+Pg) of W83 (B) and upon treatment with KYT inhibitors prior to HDMEC Pg infection (C). In vitro permeability assay of HMEC‐1 infected with W83 or ΔK/R‐ab (D). Data in B&C are presented as means ± SD and were analysed by one‐way ANOVA followed by Tukey’s post hoc comparison test. *P < 0.05, ***P < 0.001. Data in D are presented as means ± SD and were analysed by Student's t‐test. ***P < 0.001; for all experiments, n = 3 individual experiments with each individual experiment performed in triplicate technical repeats. |
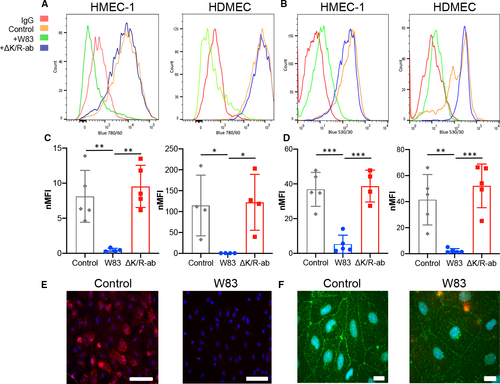
Degradation of endothelial cell surface‐expressed junctional adhesion molecules in vitro. Representative flow cytometry histograms of cell surface expression of PECAM‐1 (A) and VE‐cadherin (B) on HMEC‐1 and HDMEC following infection with Pg W83 (green) or ΔK/R‐ab mutant (blue); IgG control (red); and uninfected control (orange). Normalised median fluorescence intensity (nMFI) histograms of PECAM‐1 (C) and VE‐cadherin (D) on HMEC‐1 and HDMEC following infection with Pg W83, ΔK/R‐ab or uninfected control (enclosed circles represent data from each individual experiment, n = 4). Statistical differences were analysed by one‐way ANOVA with Tukey’s multiple comparison test *P < 0.05, **P < 0.01, ***P < 0.001. Micrograph images show immunofluorescent detection of cell surface expression of PECAM‐1 (red, E) and VE‐cadherin (green, F) in control or Pg‐treated HDMEC (n = 3). Nuclei were counterstained blue with DAPI. Scale bars in E & F = 100 μm. |
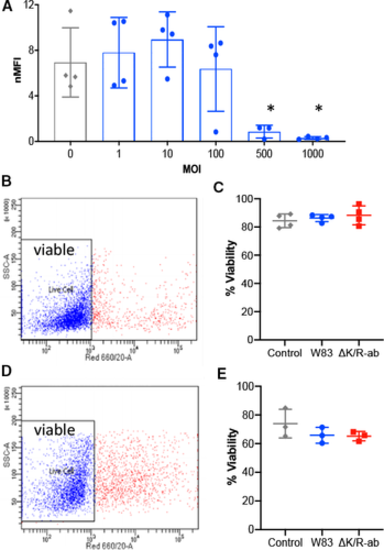
Pg‐mediated decrease in PECAM‐1 cell surface abundance is MOI‐dependent on viable endothelial cells. (A) PECAM‐1 cell surface abundance on HMEC‐1 cells as determined by flow cytometric analysis following infection with increasing MOI of Pg; uninfected cells were used as controls (enclosed circles represent data from each individual experiment). Data are displayed as normalised median fluorescence intensity (nMFI), and statistical differences were analysed by one‐way ANOVA with Tukey’s multiple comparison test; *P < 0.05, **P < 0.01 compared with MOI 0, 1, 10. HMEC‐1 (B&C) and HDMEC (C&D) viability postinfection as assessed by a live/dead TO‐PRO‐3 exclusion flow cytometric assay. The level of per cent viable cells (TO‐PRO‐3‐negative, blue dots) in the cell population was measured for W83 and ΔK/R‐ab‐treated cells. One‐way ANOVA with Tukey’s multiple comparison test showed no statistically significant differences in cell survival between groups following infection. |
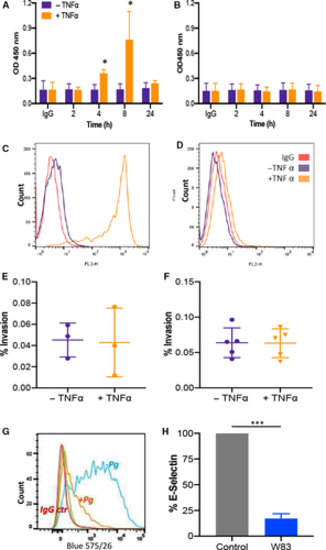
Pg W83 infection decreases E‐selectin abundance on HDMEC in vitro. Cell surface abundance of E‐selectin increased in a time‐dependent manner on HDMEC (A) upon treatment with TNFα (10 ng·mL−1) when analysed by cell‐based ELISA. Expression increased at 4 h, displayed maximal expression after 8 h (P < 0.05, Mann–Whitney U‐test, n = 3) with levels returning to baseline by 24 h. HMEC‐1 cells did not express E‐selectin at any time point examined (B). These data were confirmed by flow cytometric analysis where E‐selectin abundance was increased on HDMEC after 8 h TNFα stimulation (C) but was not present on HMEC‐1 with levels being similar to unstimulated controls (D). Whisker plots showing that stimulation of HDMEC (E) or HMEC‐1 (F) with 10 ng·mL−1 TNFα for 8 h did not result in increased invasion of Pg W83 compared with unstimulated control cells (enclosed squares and circles denote number of experiments performed, and data are mean ± SD). Representative flow cytometry histogram of cell surface expression of E‐selectin (G) on 8 h TNFα‐stimulated HDMEC following infection with Pg W83 (orange), IgG control (red) and uninfected control (blue). E‐selectin normalised median fluorescence intensity (nMFI) histograms of Pg W83‐infected and Pg W83‐uninfected controls. Statistical differences in E, F and H were analysed by Mann–Whitney U‐test of n = 3 independent experiments, ***P < 0.001. |

ZFIN is incorporating published figure images and captions as part of an ongoing project. Figures from some publications have not yet been curated, or are not available for display because of copyright restrictions. |
|
ZFIN is incorporating published figure images and captions as part of an ongoing project. Figures from some publications have not yet been curated, or are not available for display because of copyright restrictions. |
|
ZFIN is incorporating published figure images and captions as part of an ongoing project. Figures from some publications have not yet been curated, or are not available for display because of copyright restrictions. EXPRESSION / LABELING:
PHENOTYPE:
|