
Fig. 5
- ID
- ZDB-FIG-210405-26
- Publication
- Farrugia et al., 2020 - Mechanisms of vascular damage by systemic dissemination of the oral pathogen Porphyromonas gingivalis
- Other Figures
- All Figure Page
- Back to All Figure Page
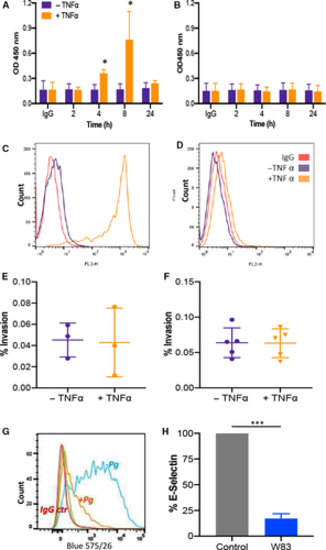
Pg W83 infection decreases E‐selectin abundance on HDMEC in vitro. Cell surface abundance of E‐selectin increased in a time‐dependent manner on HDMEC (A) upon treatment with TNFα (10 ng·mL−1) when analysed by cell‐based ELISA. Expression increased at 4 h, displayed maximal expression after 8 h (P < 0.05, Mann–Whitney U‐test, n = 3) with levels returning to baseline by 24 h. HMEC‐1 cells did not express E‐selectin at any time point examined (B). These data were confirmed by flow cytometric analysis where E‐selectin abundance was increased on HDMEC after 8 h TNFα stimulation (C) but was not present on HMEC‐1 with levels being similar to unstimulated controls (D). Whisker plots showing that stimulation of HDMEC (E) or HMEC‐1 (F) with 10 ng·mL−1 TNFα for 8 h did not result in increased invasion of Pg W83 compared with unstimulated control cells (enclosed squares and circles denote number of experiments performed, and data are mean ± SD). Representative flow cytometry histogram of cell surface expression of E‐selectin (G) on 8 h TNFα‐stimulated HDMEC following infection with Pg W83 (orange), IgG control (red) and uninfected control (blue). E‐selectin normalised median fluorescence intensity (nMFI) histograms of Pg W83‐infected and Pg W83‐uninfected controls. Statistical differences in E, F and H were analysed by Mann–Whitney U‐test of n = 3 independent experiments, ***P < 0.001. |