
- Title
-
Identification and requirements of enhancers that direct gene expression during zebrafish fin regeneration
- Authors
- Thompson, J.D., Ou, J., Lee, N., Shin, K., Cigliola, V., Song, L., Crawford, G.E., Kang, J., Poss, K.D.
- Source
- Full text @ Development
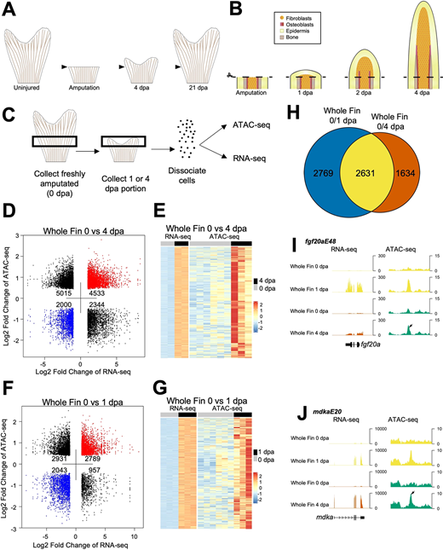
Chromatin accessibility profiling of regenerating zebrafish fins. (A) By 4 dpa, the fin regeneration blastema is formed, and proliferating fibroblasts and osteoblasts actively restore lost mesenchymal tissue, extracellular matrix and bone. Zebrafish are able to fully regenerate their fins by 2-3 weeks after injury. (B) Immediately following fin ray amputation, epidermal cells migrate to cover the site of injury and signal to the underlying mesenchyme, which forms a regeneration blastema. The blastema is formed by 2 dpa, and osteoblasts align at the basal epidermal layer and begin to deposit matrix by 3-4 dpa. (C) Overview of sample collection and enzymatic dissociation for ATAC-seq and RNA-seq profiling of 0 dpa, 1 dpa and 4 dpa fin tissue. Uninjured samples were collected from ∼1.5 mm portions of tissue from the middle region of fins, while regenerating samples were collected at 1 or 4 dpa from the regenerating tissue and one joint proximal to the amputation plane. Each sample contained 15 pooled fin clips. (D) Dot plot of differential ATAC-seq chromatin regions linked to nearby differential transcripts in 4 dpa versus 0 dpa whole-fin samples. Each point indicates a separate ATAC-seq peak. (E) Heat map of increased transcripts in 4 dpa versus 0 dpa regenerating whole-fin tissue linked to nearby differentially accessible chromatin regions. Uninjured 0 dpa samples for both 4 dpa and 1 dpa datasets were used to consider batch effects when performing differential comparison. (F) Dot plot of differential ATAC-seq chromatin regions linked to nearby differential transcripts in 1 dpa versus 0 dpa whole-fin samples. Each point indicates a separate ATAC-seq peak. (G) Heat map of upregulated transcripts in 1 dpa versus 0 dpa regenerating whole-fin tissue linked to nearby differentially accessible chromatin regions. Uninjured 0 dpa samples for both 4 dpa and 1 dpa datasets were used to consider batch effects when performing differential comparison. (H) Venn diagram comparison of differentially expressed genes in 0 versus 1 dpa compared with 0 versus 4 dpa RNA-seq data. Many of the transcripts that are differential at 4 dpa from 0 dpa are also differential at 1 dpa. (I,J) Browser tracks of TREEs near fgf20a, fgf20aE48 (I) and mdka, mdkaE20 (J). Both genes increase transcript levels during regeneration. Tracks represent normalized combined replicates. |

The fgf20aE48 enhancer directs epidermal expression in regenerating fins. (A) The fgf20aE48-fos:EGFP enhancer reporter construct. The 954 bp candidate TREE (blue arrow) was placed upstream of a 96 bp c-fos minimal promoter (yellow arrow) to direct fluorescent EGFP expression (green arrow). (B,C) Larval expression of HGn21A:EGFP and fgf20aE48:EGFP enhancer reporter lines. At 5 days post fertilization (dpf), HGn21A:EGFP is detectable in brain (br), trunk muscle (mus) and other structures (B), while fgf20aE48:EGFP is present in brain in this reporter line. A high magnification view of the larval head is shown for each sample (B′,C′). Scale bars: 500 μm. (D-G′) Longitudinal sections of 4 dpa fins showing the wound epidermal expression of fgf20a (arrowheads) by in situ hybridization in wild-type fins (D) and fgf20aE48Δ/Δ fins (E), immunofluorescence detection of EGFP in HGn21A:EGFP fins (F,F′), and immunofluorescence detection of EGFP in fgf20aE48:EGFP fins (G,G′). Scale bars: 100 μm. (H-K) Expression of HGn21A:EGFP in the distal edge of an uninjured caudal fin (H,I); similar fluorescence is not detectable in fgf20aE48:EGFP fish (J,K). Autofluorescent pigment cells are present at the tips of dorsal fin rays. The distal edge is indicated by an arrowhead. Scale bars: 300 μm. (L-N) HGn21A:EGFP fins show expression in the wound epidermis at multiple stages following injury and persisting throughout regeneration at the leading edge. Arrowheads indicate the amputation plane. Scale bars: 300 μm. (O-Q) fgf20aE48:EGFP reporter regenerates display EGFP expression at 4 dpa but not at other assessed timepoints. Scale bars: 300 μm. (R,S) qPCR analysis of fgf20a transcript levels in fgf20aE48Δ/Δ and wild-type clutchmate (WT) fins. Each biological replicate pool of three fins each was performed in technical triplicate, and paired two-tailed t-tests were performed to indicate significance. (n=8). (T) Lengths of regenerates are slightly reduced at 4 dpa (5.5%), 7 dpa (6.0%) and 14 dpa (7.0%) in fgf20aE48Δ/Δ fins compared with those of wild-type siblings (n=8). Paired two-tailed t-tests were performed to indicate significance. Data are mean±s.d. |
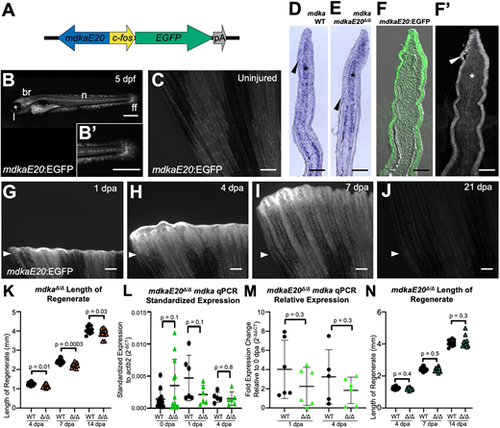
A TREE linked to mdka directs epidermal gene expression. (A) The mdkaE20-fos:EGFP enhancer reporter construct. The 1310 bp regulatory sequence (blue arrow) was placed upstream of a 96 bp c-fos minimal promoter (yellow arrow) to drive fluorescent EGFP expression (green arrow). (B) mdkaE20:EGFP larvae express EGFP in brain (br), notochord (n), lens (l) and fin fold (ff). High-magnification view of the larval tail includes the end of the notochord and caudal fin fold (B′). Scale bars: 500 μm. (C) mdkaE20:EGFP fish do not express appreciable amounts of EGFP in uninjured caudal fins. Scale bar: 300 μm. (D-F′) Longitudinal sections of 4 dpa fins indicating expression of mdka RNA in the mesenchyme (asterisks) and epidermis (arrowheads) via in situ hybridization in wild-type (D) and mdkaE20Δ/Δ (E) fin sections. Similar patterns were observed for EGFP immunofluorescence in the epidermis (strong) and mesenchyme (weak) of mdkaE20:EGFP regenerates (F,F′). Scale bars: 100 μm. (G-J) mdkaE20:EGFP reporter fish display clear injury-induced EGFP at 1 dpa, with expression detectable beyond 7 dpa and fading by 21 dpa. Arrowheads indicate amputation plane. Scale bars: 300 μm. (K) Fin regeneration in mdkaΔ/Δ animals is slightly but measurably delayed compared with wild-type fins at 4 dpa (7.3%), 7 dpa (7.9%) and 14 dpa (4.4%) (n=14). (L,M) qPCR indicating that mdka mRNA levels are similar in mdkaE20Δ/Δ and wild-type fins in expression (L), and in expression relative to respective 0 dpa mdkaE20Δ/Δ or wild type (M). Each biological replicate pool of three fins each was performed in technical triplicate, and paired two-tailed t-tests were performed to indicate significance (n=6). (N) Fin regeneration in mdkaE20Δ/Δ fish is similar to wild type (n=14). Paired two-tailed t-tests were performed to indicate significance. Data are mean±s.d. |
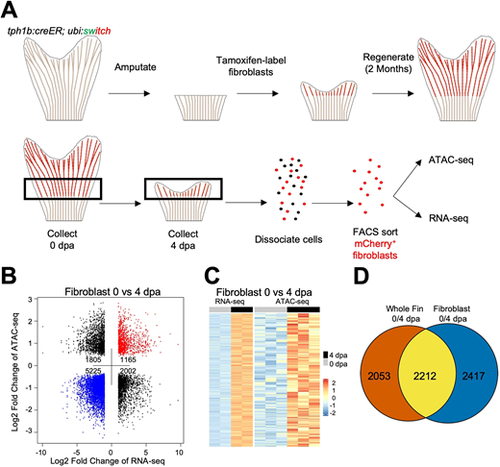
Chromatin accessibility profiling of fibroblasts purified from regenerating fins. (A) Overview of genetic labelling, sample collection and isolation of 0 dpa and 4 dpa fin fibroblasts for transcriptional and chromatin accessibility profiling from tph1b:CreER; ubi:switch fish. Uninjured samples were collected from ∼1.5 mm fin slits, while regenerating samples were collected at 4 dpa from the regenerating tissue and one joint proximal to the amputation plane. Each sample contained 75 pooled fin clips, dissociated and sorted for 100 K mCherry+ cells. (B) Dot plot of differential ATAC-seq chromatin regions linked to nearby differential transcripts in 4 dpa versus 0 dpa fibroblast samples. Each point indicates a separate ATAC-seq peak. (C) Heat map of increased transcripts in 4 dpa versus 0 dpa regenerating fibroblast tissue linked to nearby differentially accessible chromatin regions. (D) Venn diagram of differential transcriptomic data, indicating overlap between 0 versus 4 dpa differential fibroblast transcriptomes and differential 0 versus 4 dpa whole-fin transcriptomes. |
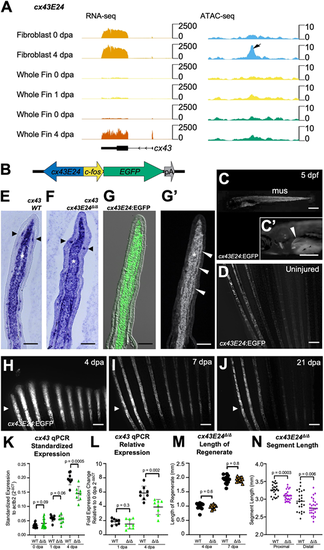
A TREE linked to cx43 directs blastemal gene expression. (A) RNA-seq and ATAC-seq browser tracks indicating the cx43E24 TREE near the upregulated cx43 transcript in regenerating fibroblast and whole-fin tissue. Tracks represent normalized combined replicates. (B) The cx43E24-fos:EGFP enhancer reporter construct. The 945 bp candidate TREE (blue arrow) was placed upstream of a 96 bp c-fos minimal promoter (yellow arrow) to direct fluorescent EGFP expression (green arrow). (C) Larval cx43E24:EGFP animals at 5 days post fertilization (dpf) displaying EGFP expression in trunk muscle (mus) and early pectoral fins. High magnification view of a larval pectoral fin (arrowhead) (C′). Scale bars: 500 μm. (D) The three dorsal-most caudal fin rays in some strongly expressing cx43E24:EGFP animals express EGFP in uninjured tissue, although this is not present in all lines. Scale bar: 300 μm. (E-G′) Longitudinal sections indicate cx43 expression (violet) in fibroblasts (white asterisks) and joint osteoblasts in wild-type fish (E) and cx43E24Δ/Δ fish (F) by in situ hybridization. Expression in forming joints is marked by black arrowheads. cx43E24:EGFP reporter fish exhibit a similar EGFP immunofluorescence pattern to endogenous cx43, although EGFP expression is detected in most blastemal osteoblasts (white arrowheads) in addition to blastemal fibroblasts (white asterisk) (G,G′). Scale bars: 100 μm. (H-J) cx43E24:EGFP fish display mesenchymal EGFP expression by 4 dpa, fading by 21 dpa. Arrowheads indicate amputation plane. Scale bars: 300 μm. (K,L) qPCR analysis of cx43 transcript levels in cx43E24Δ/Δ and wild-type fins. Expression is induced at 4 dpa but to a lesser extent than in wild-type fins. Each biological replicate pool of three fins each was performed in technical triplicate, and paired two-tailed t-tests were performed to indicate significance (n=8). (M) Lengths of regenerating fins are similar in cx43E24Δ/Δ and wild-type fish (n=14). Paired two-tailed t-tests were performed to indicate significance. (N) Fin ray segment length at 7 dpa was decreased by 6.2% distal to the amputation plane and 5.2% shorter proximal to the amputation plane in regenerating cx43E24Δ/Δ fins compared with wild-type fins (n=14). Paired two-tailed t-tests were performed to indicate significance. Data are mean±s.d. |
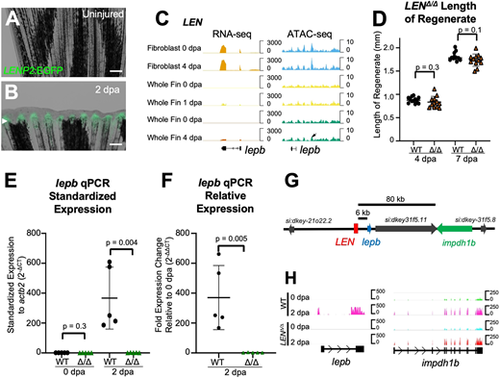
LEN is essential for lepb expression during fin regeneration. (A,B) LENP2:EGFP fish display EGFP expression in the blastema by 2 dpa, as reported by Kang et al. (2016). Arrow indicates amputation plane. Scale bars: 300 μm. (C) Browser tracks indicating the LEN TREE (arrow) near the upregulated lepb transcript in regenerating fibroblast and whole fin tissue. While LEN is accessible in whole fin and fibroblast tissue, its accessibility is not considered dynamic during regeneration. Tracks represent normalized combined replicates. (D) Lengths of regenerating fins are similar in LENΔ/Δ and wild-type fish (n=12). Paired two-tailed t-tests were performed to indicate significance. Data are mean±s.d. (E,F) qPCR analysis of lepb transcript levels in in LENΔ/Δ and WT fins. lepb is undetectable in 2 dpa regenerating LENΔ/Δ fish. Each biological replicate pool of three fins each was performed in technical duplicate, and paired two-tailed t-tests were performed to indicate significance. (n=5). Data are mean±s.d. (G) Genomic region immediately surrounding LEN. lepb and impdh1b are induced during fin regeneration. (H) RNA-seq of LENΔ/Δ and wild-type 0 and 2 dpa regenerates. Tracks indicate an absence of lepb expression at 2 dpa in LENΔ/Δ fish, whereas impdh1b transcript levels are increased similarly in both wild type and LENΔ/Δ upon fin amputation. Tracks represent individual replicates. |
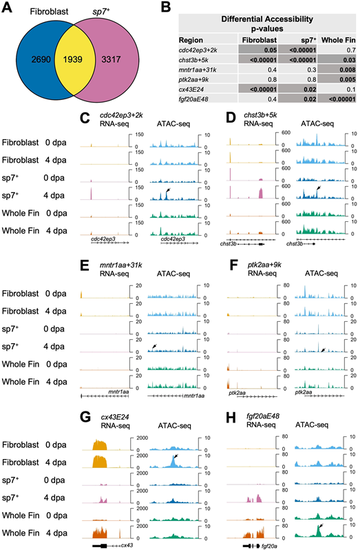
Regenerating fibroblast and osteoblast populations show distinct chromatin accessibility patterns. (A) Venn diagram of comparative analysis indicating overlap in differentially expressed transcripts in purified fibroblasts and sp7+ osteoblasts. (B) Table of P-values for differential accessibility changes in TREEs from this study and that by Lee et al. (2020), representing sp7+ osteoblasts, fibroblasts and whole-fin datasets. Differentially accessible peaks at P<0.05 are noted with darker cells. (C-F) RNA-seq and ATAC-seq browser tracks in sp7+ osteoblasts, fibroblasts and whole-fin datasets indicating TREEs reported by Lee et al. (2020) in sp7+ osteoblasts. Osteoblast TREEs cdc42ep3+2k and chst3b+5k exhibit a significant decrease in accessibility in regenerating fibroblast tissue (C,D), whereas sp7− TREEs mntr1aa+31k and ptk2aa+9k exhibit increased accessibility in regenerating whole-fin tissue at 4 dpa (E,F). Tracks represent normalized combined replicates. (G,H) RNA-seq and ATAC-seq browser tracks in sp7+ osteoblasts, fibroblasts and whole-fin datasets indicating TREEs presented in this study. Both the mesenchymal TREE cx43E24 (G) and epidermal TREE fgf20aE48 (H) exhibit increased accessibility in sp7+ osteoblasts at 4 dpa compared with 0 dpa. |