
|
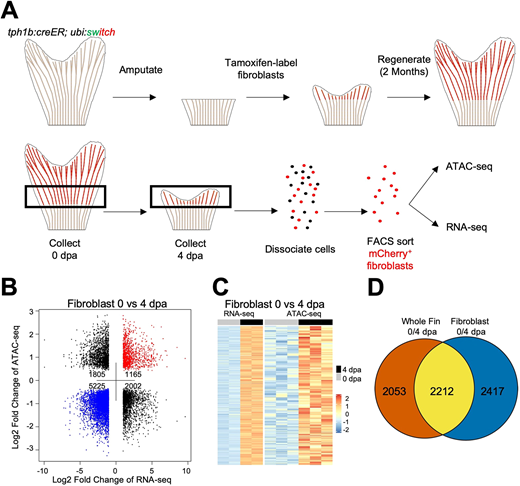
Fig. 4 Chromatin accessibility profiling of fibroblasts purified from regenerating fins. (A) Overview of genetic labelling, sample collection and isolation of 0 dpa and 4 dpa fin fibroblasts for transcriptional and chromatin accessibility profiling from tph1b:CreER; ubi:switch fish. Uninjured samples were collected from ∼1.5 mm fin slits, while regenerating samples were collected at 4 dpa from the regenerating tissue and one joint proximal to the amputation plane. Each sample contained 75 pooled fin clips, dissociated and sorted for 100 K mCherry+ cells. (B) Dot plot of differential ATAC-seq chromatin regions linked to nearby differential transcripts in 4 dpa versus 0 dpa fibroblast samples. Each point indicates a separate ATAC-seq peak. (C) Heat map of increased transcripts in 4 dpa versus 0 dpa regenerating fibroblast tissue linked to nearby differentially accessible chromatin regions. (D) Venn diagram of differential transcriptomic data, indicating overlap between 0 versus 4 dpa differential fibroblast transcriptomes and differential 0 versus 4 dpa whole-fin transcriptomes.