
- Title
-
The mevalonate pathway is a critical regulator of tendon cell specification
- Authors
- Chen, J.W., Niu, X., King, M.J., Noedl, M.T., Tabin, C.J., Galloway, J.L.
- Source
- Full text @ Development
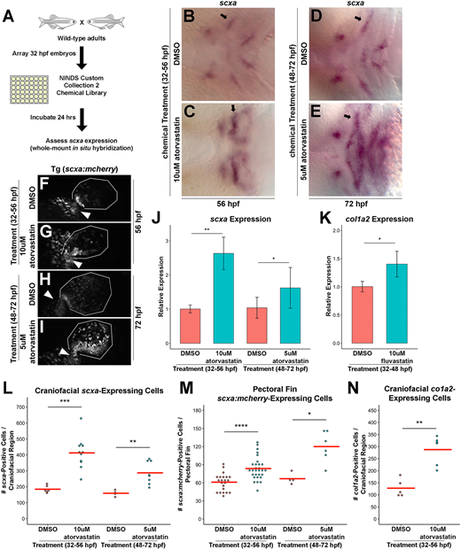
A zebrafish chemical screen identifies statins as regulators of craniofacial and pectoral fin tendon progenitors. (A) Design of the small-molecule screen. Wild-type embryos were incubated with individual compounds from 32 to 56 hpf and alterations in craniofacial scxa expression were assessed at 56 hpf. (B-E) Craniofacial scxa expression at 56 hpf, after incubation from 32 to 56 hpf (B,C) and at 72 hpf after incubation from 48 to 72 hpf (D,E). Atorvastatin expanded scxa expression in the pharyngeal arches (arrows) compared with controls. (F-I) Pectoral fin scxa:mcherry expression at 56 hpf (F,G) and 72 hpf (H,I) upon incubation from 32 to 56 hpf and 48 to 72 hpf, respectively. Atorvastatin expanded scxa:mcherry expression at the cleithrum base (arrowhead), extending distally to the actinotrichia. (J) qPCR quantification revealed that atorvastatin increased scxa expression at 56 hpf and 72 hpf upon incubation from 32 to 56 hpf and 48 to 72 hpf, respectively, compared with controls. n=4, whole embryo (32-56 hpf) and head region (48-72 hpf); Welch's two-tailed t-test. (K) qPCR quantification revealed that fluvastatin increased col1a2 expression at 72 hpf, after incubation from 32 to 48 hpf compared with controls. The combination of fluvastatin, which is characterized by a shorter half-life and a shortened exposure window (Fig. S2M-R), mitigated the toxic effects observed at 72 hpf with atorvastatin treatment. n=3, head region, Welch's two-tailed t-test. (L) Atorvastatin increased the quantity of craniofacial scxa+ cells at 56 hpf and 72 hpf after incubation from 32 to 56 hpf and 48 to 72 hpf, respectively, compared with controls. (M) Atorvastatin increased the quantity of pectoral fin scxa:mcherry+ cells at 56 hpf and 72 hpf upon incubation from 32 to 56 hpf and 48 to 72 hpf, respectively, compared with controls. (N) Atorvastatin increased the quantity of col1a2+ cells at 80 hpf, after incubation from 32 to 56 hpf compared with controls. (J,K) Data are mean±s.d. (L-N) Red bars indicate mean; individual points represent values for individual embryos; Mann–Whitney-Wilcoxon test. *P<0.05; **P<0.01; ***P<0.001; ****P<0.0001. Ventral (B-E) and lateral (F-I) views, anterior towards the left. |
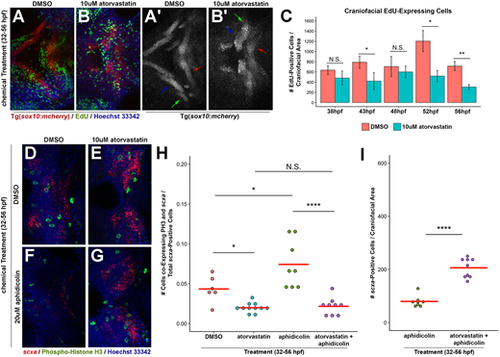
Statin-mediated expansion of craniofacial tendon progenitors is not due to increased proliferation of scxa-positive cells. (A,B) Tg(sox10:mcherry) embryos at 56 hpf were chemically treated from 32 to 56 hpf, labeled for EdU+ cells and counterstained with Hoechst. Arrows in A′,B′ mark Meckel's cartilage (blue), palatoquadrate cartilage (green) and ceratohyal cartilage (red). (C) Quantification of EdU+ cells in the craniofacial region upon incubation from 32 hpf. Atorvastatin does not increase the quantity of craniofacial EdU+ cells at timepoints examined, compared with controls. n=3, Welch's two-tailed t-test. Data are mean±s.d. (D-G) Craniofacial expression of scxa and phospho-histone H3 (PH3) at 56 hpf upon incubation with the indicated compounds from 32 to 56 hpf. Craniofacial scxa expression compared with controls (D) is reduced in aphidicolin-treated embryos (F), and expanded in embryos treated with atorvastatin alone (E) and in combination with aphidicolin (G). Data from these representative images are plotted in H,I and Fig. S3A. (H) Quantification of craniofacial cells co-expressing PH3 and scxa at 56 hpf after incubation from 32 to 56 hpf. (I) Quantification of scxa+ cells indicated that decreased proliferation does not hamper atorvastatin-mediated scxa expansion. (H,I) Red bars indicate mean; individual points represent values for individual embryos; Mann–Whitney-Wilcoxon test. N.S., no significance; *P<0.05; **P<0.01; ****P<0.0001. Representative craniofacial domain analyzed is shown in A-B′,D-G. Ventral (A-B′,D-G) views, anterior towards the left. |
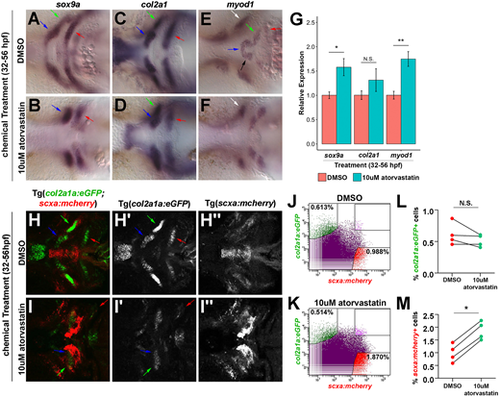
Effect of statin on the craniofacial musculoskeleton. (A-F) Craniofacial expression of sox9a, col2a1 and myod1 at 56 hpf upon incubation from 32 to 56 hpf. At 56 hpf, atorvastatin altered the spatial expression patterns of sox9a (A,B), col2a1 (C,D) and myod1 (E,F) compared with controls. Arrows in A-D,H-I′ mark Meckel's cartilage (blue), palatoquadrate cartilage (green) and ceratohyal cartilage (red). Arrows in E,F mark intermandibularis anterior (blue), intermandibularis posterior (black), interhyal (green), hyohyal (red) and adductor mandibularis (white). (G) qPCR quantification revealed that atorvastatin increased sox9a and myod1 expression, but not col2a1 at 56 hpf after incubation from 32 to 56 hpf compared with controls. n=3, whole embryo, Welch's two-tailed t-test. Data are mean±s.d. (H,I) Craniofacial expression of col2a1a:eGFP;scxa:mcherry at 56 hpf upon incubation from 32 to 56 hpf. Corresponding views of eGFP (H′,I′) and mcherry (H″,I″). (J,K) Representative flow cytometry analysis of mcherry+ tendon and eGFP+ cartilage cells at 56 hpf in the head region of Tg(scxa:mcherry;col2a1a:eGFP) embryos after incubation from 32 to 56 hpf. Atorvastatin expanded mcherry+ tendon progenitors (0.988% in DMSO; 1.870% in atorvastatin). (L,M) Flow cytometry quantification of eGFP+ and mcherry+ cells at 56 hpf in the head region of Tg(scxa:mcherry;col2a1a:eGFP) embryos after incubation from 32 to 56 hpf. Atorvastatin increased mcherry+ cells but not eGFP+ cells (n=4; Mann–Whitney-Wilcoxon test). N.S., no significance; *P<0.05; **P<0.01. Ventral views (A-F,H-I″), anterior towards the left. |
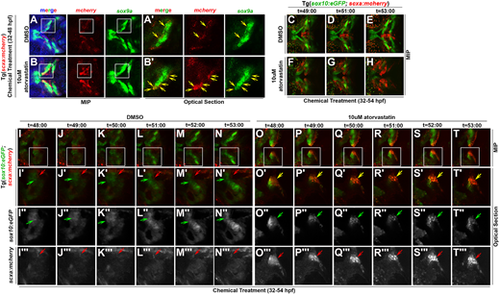
Statin expands the scxa-expressing cell population by promoting tenogenic specification of CNC. (A-B′) Expression of mcherry and sox9a in (A,A′) DMSO and (B,B′) atorvastatin-treated Tg(scxa:mcherry) embryos at 48 hpf. White boxes mark the craniofacial domain in maximum intensity projection (MIP) (A,B), magnified in corresponding optical sections (A′,B′). Yellow arrows mark mcherry+/sox9a+ cells. Atorvastatin expanded mcherry+/sox9a+ cells (B′, compare with A′). (C-T‴) Time-course of live imaging of tendon and cartilage development in (C-E,I-N‴) DMSO- and (F-H,O-T‴) atorvastatin-treated Tg(sox10:eGFP;scxa:mcherry) embryos (n=4 shown). Arrows mark sox10:eGFP+ cells of Meckel's cartilage (green), scxa:mcherry+ tendon progenitors (red) and scxa:mcherry+/sox10:eGFP+ cells (yellow). Atorvastatin expanded scxa:mcherry+/sox10:eGFP+ cells near the region where Meckel's cartilage forms (compare F-H and O-T‴ with C-E and I-N‴, respectively). White boxes mark the craniofacial domain in the MIPs (I-T) of high-resolution images, magnified in the corresponding MIPs (I′-T′) and optical sections: eGFP (I″-T″) and mcherry (I‴-T‴) expression. Ventral views, anterior towards the left. |
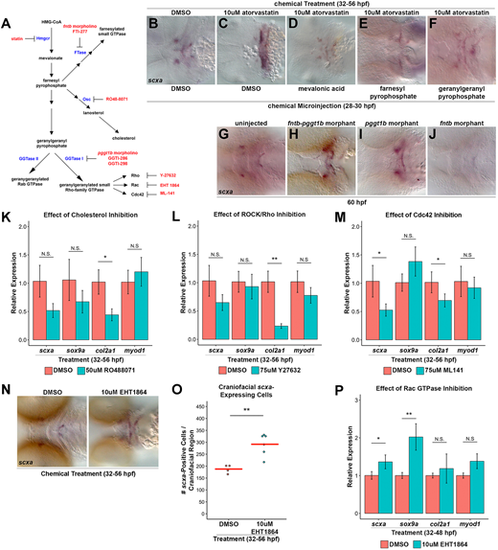
Inhibition of geranylgeranylation branch causes statin-mediated tendon cell expansion. (A) Schematic of Hmgcr pathway with enzymes (blue), inhibitors (red) and morpholinos (red) indicated. (B,C) scxa expression in control DMSO-treated/DMSO-injected embryos at 56 hpf (B, 100%; n=30) is expanded upon atorvastatin treatment and DMSO injection (C, 100%; n=62). (D-F) scxa expression is rescued to wild-type levels in embryos incubated with atorvastatin from 32 to 56 hpf and injected at 28 hpf with mevalonic acid (D, 94% rescued; n=18), farnesyl pyrophosphate (E, 33% rescued; n=72) or geranylgeranyl pyrophosphate (F, 49% rescued; n=43). (G-J) At 60 hpf, craniofacial scxa expression, compared with controls (G, 100% wild type, n=41), is expanded in fntb-pggt1b morphants (H, 73% expanded, n=103) and pggt1b morphants (I, 60% expanded, n=89), and reduced in fntb morphants (J, 29% reduced; 71% normal expression, n=17). (K-M) qPCR analysis of scxa, sox9a, col2a1 and myod1 expression at 56 hpf after incubation from 32 to 56 hpf. (K) Cholesterol biosynthesis inhibition (using RO48-8071) reduced col2a1, but had no effect on scxa, sox9a and myod1 compared with controls. (L) ROCK/Rho inhibition (using Y-27632) reduced col2a1, but had no effect on scxa, sox9a and myod1 compared with controls. (M) Cdc42 GTPase inhibition (using ML-141) reduced scxa and col2a1, but did not affect sox9a and myod1. (N) Rac GTPase inhibition (using EHT-1864) expanded scxa expression at 56 hpf after incubation from 32 to 56 hpf. (O) EHT-1864 increased the quantity of scxa+ cells at 56 hpf after incubation from 32 to 56 hpf. (P) qPCR analysis of scxa, sox9a, col2a1 and myod1 expression at 56 hpf after incubation from 32 to 56 hpf. EHT-1864 increased expression of scxa and sox9a, but did not affect col2a1 and myod1. For qPCR (K-M,P), n=3, head region, Welch's two-tailed t-test. Data are mean±s.d. (O) Red bars indicate mean; points represent individual embryos; Mann–Whitney-Wilcoxon test. N.S., not significant; *P<0.05; **P<0.01. Ventral views (B-J,N), anterior towards the left. |
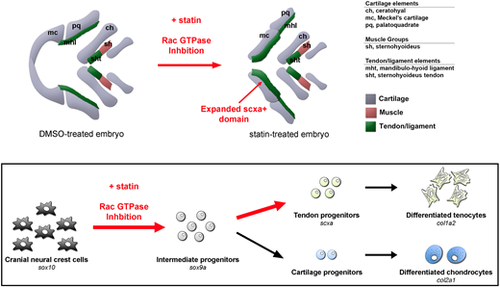
Model for the mechanism of statin-mediated expansion of zebrafish craniofacial tendon program. Schematic illustrates selected craniofacial cartilage, muscle and tendon/ligament groups in ventral view of DMSO- and statin-treated zebrafish at 56 hpf after incubation from 32 to 56 hpf. Exposure of multipotential chondrocyte-tendon progenitors to statins results in re-specification towards a tendon fate – a process mediated through RAC GTPase inhibition. This cell fate expansion is spatially restricted to subsets of CNC-derived elements. |