
|
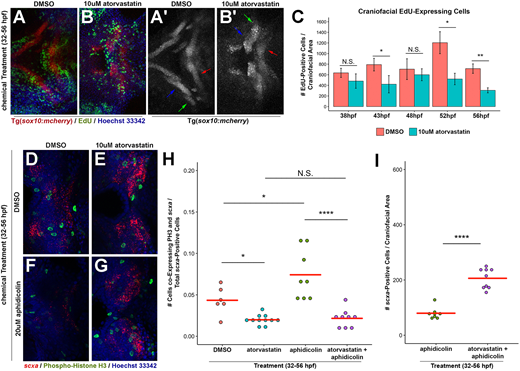
Fig. 2 Statin-mediated expansion of craniofacial tendon progenitors is not due to increased proliferation of scxa-positive cells. (A,B) Tg(sox10:mcherry) embryos at 56 hpf were chemically treated from 32 to 56 hpf, labeled for EdU+ cells and counterstained with Hoechst. Arrows in A′,B′ mark Meckel's cartilage (blue), palatoquadrate cartilage (green) and ceratohyal cartilage (red). (C) Quantification of EdU+ cells in the craniofacial region upon incubation from 32 hpf. Atorvastatin does not increase the quantity of craniofacial EdU+ cells at timepoints examined, compared with controls. n=3, Welch's two-tailed t-test. Data are mean±s.d. (D-G) Craniofacial expression of scxa and phospho-histone H3 (PH3) at 56 hpf upon incubation with the indicated compounds from 32 to 56 hpf. Craniofacial scxa expression compared with controls (D) is reduced in aphidicolin-treated embryos (F), and expanded in embryos treated with atorvastatin alone (E) and in combination with aphidicolin (G). Data from these representative images are plotted in H,I and Fig. S3A. (H) Quantification of craniofacial cells co-expressing PH3 and scxa at 56 hpf after incubation from 32 to 56 hpf. (I) Quantification of scxa+ cells indicated that decreased proliferation does not hamper atorvastatin-mediated scxa expansion. (H,I) Red bars indicate mean; individual points represent values for individual embryos; Mann–Whitney-Wilcoxon test. N.S., no significance; *P<0.05; **P<0.01; ****P<0.0001. Representative craniofacial domain analyzed is shown in A-B′,D-G. Ventral (A-B′,D-G) views, anterior towards the left.