
- Title
-
Core Hippo pathway components act as a brake on Yap/Taz in the development and maintenance of the biliary network
- Authors
- Brandt, Z.J., Echert, A.E., Bostrom, J.R., North, P.N., Link, B.A.
- Source
- Full text @ Development
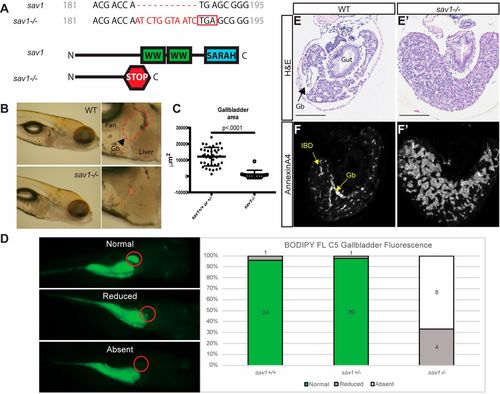
Deletion of sav1 causes larval lethality and abnormal gallbladder development. (A) Wild-type and mutant alleles of zebrafish sav1. sav1 mutants contain an 11 bp insertion (red), causing a frameshift and early stop codon (red box). (B) Morphology of embryos at 8 dpf. Dashed red lines on higher magnification images outline the gallbladder. Pan, pancreas; Gb, gallbladder. (C) Quantification of gallbladder area shown in B; gallbladder location is indicated by red circles. Unpaired t-test with equal s.d., P<0.0001. n=38, sav1+/+ or +/−; n=12, sav1−/−. Data are mean±s.d. (D) BODIPY FL C5 gallbladder uptake and ratiometric analysis at 8 dpf. Sample number (n) indicated within the graph. (E,E′) Hematoxylin and Eosin stained paraffin sections of normal gallbladder and liver in wild-type and sav1−/− mutants. Gb, gallbladder. Scale bars: 100 μm. (F,F′) Adjacent sections stained for annexin A4 confirm abnormal biliary morphology. Gb, gallbladder; IBD, intrahepatic bile duct. n=5 for both wild-type and sav1−/− paraffin histology. PHENOTYPE:
|
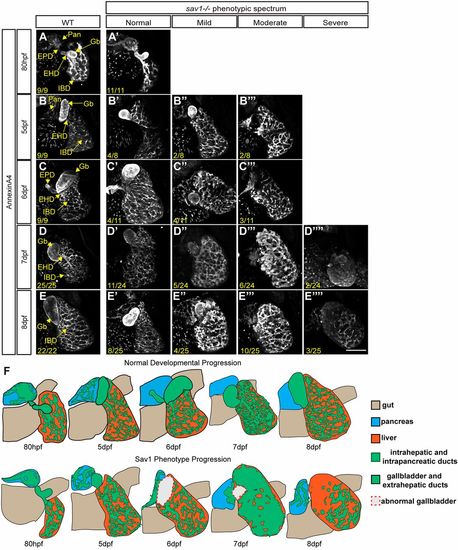
sav1 mutants display a wide spectrum of biliary morphology representative of phenotype progression. (A-E″″) Whole-mount annexin A4 staining of liver and gallbladder from 80 hpf to 8 dpf. Pan, pancreas; Gb, gallbladder; EHD, extrahepatic duct; EPD, extrapancreatic duct; IBD, intrahepatic bile duct. Numbers indicate the ratio of fish that displayed the phenotype/total fish analyzed. (F) Cartoon depictions of each time-point. EXPRESSION / LABELING:
PHENOTYPE:
|
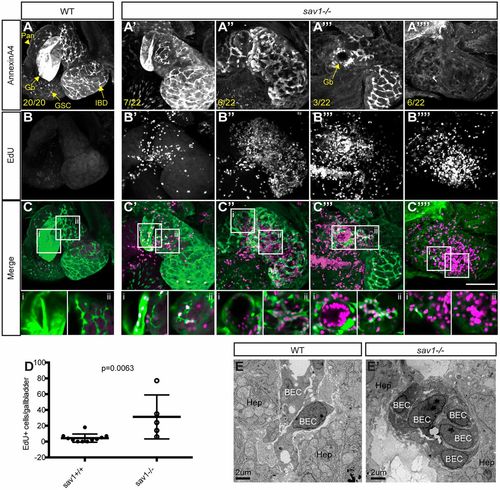
The sav1 mutant biliary system exhibits excess proliferation. (A-A″″) Whole-mount annexin A4 staining of liver and gallbladder at 8 dpf. Pan, pancreas; Gb, gallbladder; GSC, gut secretory cell; IBD, intrahepatic bile duct. n is indicated and displayed as the ratio of fish containing the displayed phenotype/total fish analyzed. (B-B″″) EdU staining of the specimen analyzed in A. (C-C″″) Merged images of A and B with annexin A4 staining in green and EdU stain in magenta. Scale bar: 100 μm. Single plane enlarged images are found below each merged image, with the left image focused on a region of gallbladder and the right image focused on intrahepatic biliary ducts. (D) Quantitation of EdU+ cells in annexin A4-labeled gallbladders; n=11 wild-type, n=5 sav1−/−. Data are mean±s.d. Unpaired t-test with equal s.d. resulted in P=0.0063. (E,E′) TEM of wild-type (E) and sav1−/− (E′) livers at 10 dpf: n=3 wild type; n=3 sav1−/−. BEC, biliary epithelial cell; Hep, hepatocyte. PHENOTYPE:
|
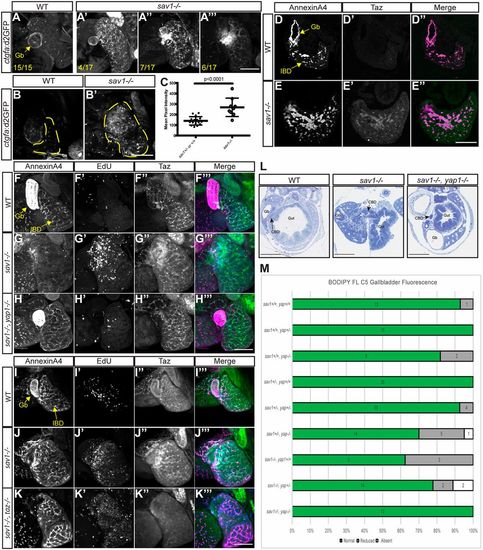
Yap but not Taz drives sav1−/− phenotypes. (A-A‴) Whole-mount GFP staining of ctgfa:d2GFP wild-type and sav1−/− embryos. Gb, gallbladder. Numbers indicate the ratio of fish that displayed the phenotype/total fish analyzed. Scale bar: 100 μm. (B,B′) Images of ctgfa:d2GFP+ wild-type and sav1−/− larvae; dashed yellow line outlines the liver. Scale bar: 100 μm. (C) Mean pixel intensity of ctgfa:d2GFP reporter in livers as outlined in B: n=16 wild-type; n=9 sav1−/−. Data are mean±s.d. Unpaired t-test with equal s.d. resulted in P<0.0001. (D-E″) Immunofluorescent staining of paraffin wax-embedded sections for Yap and Taz in sav1−/− and wild-type siblings, and colocalization with the biliary marker annexin A4. Gb, gallbladder; IBD, intrahepatic bile duct. Scale bar: 100 μm. (F-F‴) Whole-mount staining for annexin A4, EdU and Taz in wild-type larvae. Gb, gallbladder; IBD, intrahepatic bile duct. (G-G‴) Whole-mount analysis of sav1−/− larvae using the markers described in F (n=6). (H-H‴) Whole-mount analysis of sav1−/−;yap−/− larvae using the markers described in F (n=8). Scale bar: 100 μm. (I-K‴) Repeated whole-mount analysis for the markers as described in F-H (although n=5 for sav1−/−;taz−/− embryos). Scale bar: 100 μm. (L) Toluidine Blue stained sections of liver and gallbladder in wild-type, sav1−/− and sav1−/−;yap−/− larvae at 10 dpf (n=9). Gb, gallbladder; CBD, common bile duct. n=7 wild type; n=5 sav1−/−; n=4 sav1−/−;yap−/−. Scale bars: 100 μm. (M) Ratiometric analysis at 8 dpf of BODIPY FL C5 gallbladder uptake in larvae from a sav1+/−;yap+/− incross. Analyses performed at 8 dpf unless otherwise indicated. |
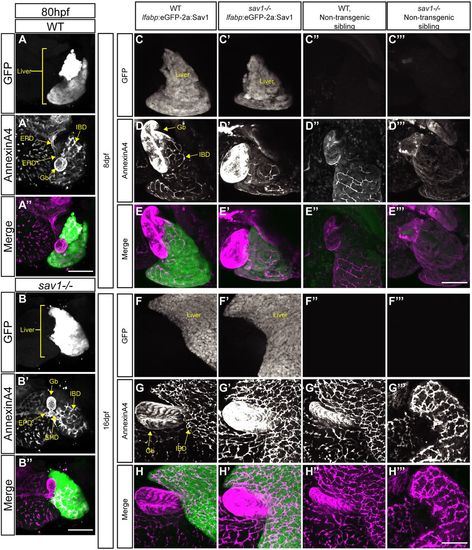
Hepatocyte Hippo signaling is crucial for larval survival and functions non-cell-autonomously to affect the intrahepatic and extrahepatic biliary system. (A,B,C-C‴,F-F‴) Whole-mount GFP staining in wild-type and sav1−/− larvae. (A′,B′,D-D‴,G-G‴) Annexin A4 staining of gallbladder and intrahepatic biliary cells. Gb, gallbladder; EHD, extrahepatic duct; EPD, extrapancreatic duct; IBD, intrahepatic bile duct. (A″,B″,E-E‴,H-H‴) Merged images with green representing GFP and magenta representing annexin A4. (A-B″) Larvae at 80 hpf (n=3 wild type, lfabp:eGFP-2a:Sav1+ and sav1−/−, lfabp:eGFP-2a:Sav1+). (C-E‴) Larvae at 8 dpf (n=8 wild type, lfabp:eGFP-2a:Sav1+; n=7 sav1−/−, lfabp:eGFP-2a:Sav1+; n=3 wild type, non-transgenic sibling; n=5 sav1−/−, non-transgenic sibling). (F-H‴) Fish at 16 dpf (n=12 wild type, lfabp:eGFP-2a:Sav1+; n=12 sav1−/−, lfabp:eGFP-2a:Sav1+; n=8 wild type, non-transgenic sibling; n=4 sav1−/−, non-transgenic sibling). Scale bars: 100 μm. PHENOTYPE:
|
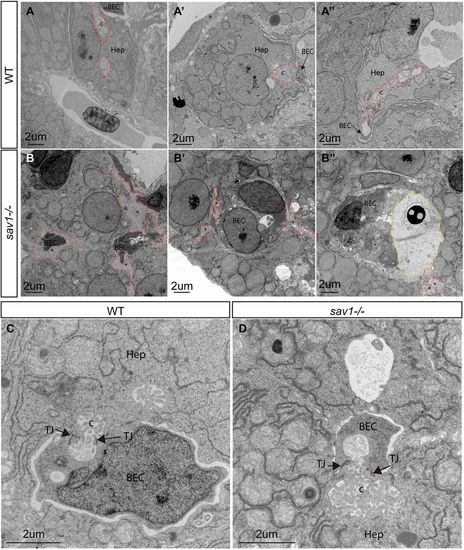
Ultrastructural defects of bile duct canaliculi in sav1−/− larvae. (A-A″) TEM examples of wild-type canaliculi and hepatocyte-biliary epithelial cell junctions. Canaliculi are outlined with dashed red lines. (B-B″) sav1−/− siblings of A-A″ showing examples of hepatocyte-to-biliary cell borders that contain membranous material reminiscent of canaliculi, but lack normal structure (dashed red lines). In B″, a dashed yellow line outlines excessive extracellular space filled with electron-dense material. (C) Higher magnification of wild-type hepatocyte-biliary epithelial cell junction and canaliculi. (D) Example of a rare canaliculi present in sav1−/− larvae showing shorter length and increased diameter. Hep, hepatocyte; BEC, biliary epithelial cell; c, canaliculi; TJ, tight junction. Asterisks indicate abnormal canaliculi or abnormal hepatocyte membrane. n=3 wild type, n=3 sav1−/−. All images are of 10 dpf larvae. PHENOTYPE:
|

Hepatocyte apical domains appear abnormal and expanded in sav1−/− larvae. (A-B‴) Examples of wild-type (A) and sav1−/− (B-B‴) 8 dpf larvae whole-mount immunostaining for Alcam. n=5 wild type, n=6 sav1−/−. Scale bar: 100 μm. (C,D) Single plane images of intrahepatic biliary ducts stained for annexin A4 in wild-type and sav1−/− 8 dpf larvae respectively. Red arrow in C indicates one annexin A4+ biliary epithelial cell. (C′,D′) Single plane images of aPKC staining in wild-type and sav1−/− 8 dpf larvae, respectively. Yellow arrow in C′ indicates one canaliculus. (C″,D″) Merged images with green representing aPKC and magenta representing annexin A4. Scale bar: 25 μm. (E-F″) Examples of wild-type and sav1−/− gallbladder stained for aPKC and annexin A4, following the same labeling conventions as in C-D″. (G,G′) Z-projections of whole-mount staining for annexin A4 and aPKC in wild-type larvae at 8 dpf. Scale bar: 25 μm. (H,H′,I,I′,J,J′) Z-projections of whole-mount staining for annexin A4 and aPKC in sav1−/− larvae at 8 dpf. (G″,H″,I″,J″) Merged images with green representing aPKC and magenta representing annexin A4 (n=7 wild type; n=5 sav1−/−). Scale bar: 100 μm. (K-K″) Z-projections of whole-mount staining for annexin A4 and Cdh2 in wild-type larvae at 8 dpf. (L,L′,M,M′,N,N′) Z-projections of whole-mount staining for annexin A4 and Cdh2 in sav1−/− larvae at 8 dpf. Yellow arrowheads in N′ indicate examples of high intensity cytoplasmic punctate Cdh2 staining, suggesting cadherin junction collapse. (L″,M″,N″) Merged images of Cdh2 (green) and annexin A4 (magenta) (n=7 wild type; n=6 sav1−/−). Scale bar: 100 μm. PHENOTYPE:
|
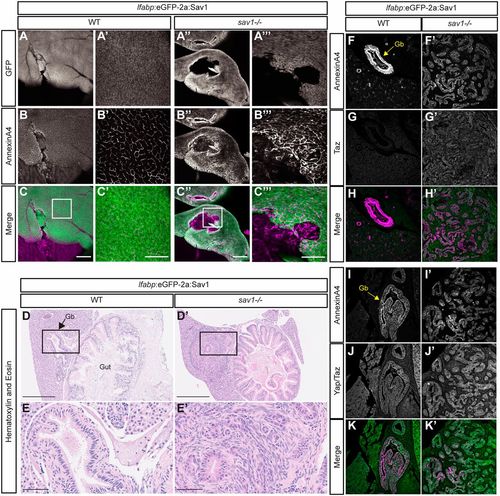
Hippo signaling functions cell-autonomously in the maintenance of the gallbladder and extrahepatic biliary ducts. (A-A‴) Whole-mount GFP staining in wild-type and sav1−/− adult fish. (B-B‴) Whole-mount annexin A4 staining in wild-type and sav1−/− adult fish. (C-C‴) Merged images of GFP (green) and annexin A4 (magenta). Scale bars: 250 μm in C,C″; 100 μm in C′,C‴. (D-E′) Hematoxylin and Eosin histology of the same fish analyzed in A-C‴. Gb, gallbladder (n=10 wild type, lfabp:eGFP-2a:Sav1+; n=8 sav1−/−, lfabp:eGFP-2a:Sav1+). Scale bars: 250 µm in D and E; 50 µm in D′ and E′. (F,F′,I,I′) Annexin A4 immunostaining on wild-type and sav1−/− dissected liver and gut of fish carrying lfabp:eGFP-2a:Sav1 transgene. Gb, gallbladder. (G,G′) Taz staining on the same sections shown in F,F′. (J,J′) Yap and Taz staining on the same sections shown in I,I′. (H,H′,K,K′) Merged images of Taz alone, Yap and Taz (green), and annexin A4 (magenta) (n=5 wild type, lfabp:eGFP-2a:Sav1+, n=3 sav1−/−, lfabp:eGFP-2a:Sav1+). PHENOTYPE:
|
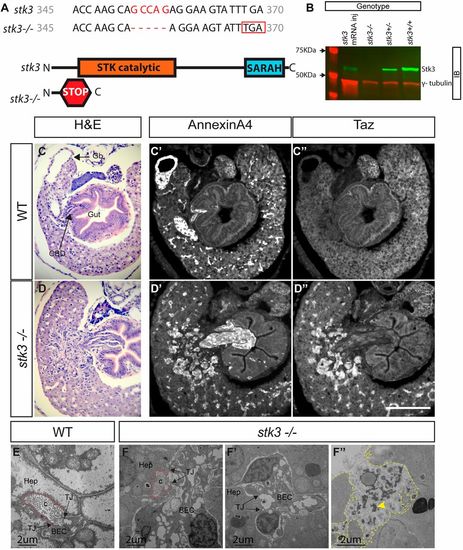
stk3 mutants phenocopy sav1 mutants, but with delayed onset. (A) Schematic depicting wild-type and mutant alleles of zebrafish stk3. stk3 mutant alleles contain a 5 bp deletion (red), causing a frameshift and early stop codon (red box). (B) Western blot of protein lysates from stk3−/−, stk3+/− and stk3+/+ single larvae at 8 dpf. γ-Tubulin staining was used as a loading control. (C-D″) Paraffin histology shows abnormal biliary cells with increased Yap and Taz levels using immunofluorescent and Hematoxylin and Eosin staining in stk3−/− fish at 16 dpf compared with wild-type siblings. Gb, gallbladder; CBD, common bile duct (n=5 wild type; n=5 stk3−/−). Scale bar: 100 μm. (E) TEM example of wild-type canaliculi and hepatocyte-biliary epithelial cell junctions. Canaliculi are outlined with dashed red lines. (F-F′) stk3−/− siblings of E showing examples of abnormal canaliculi, with shorter abnormal shape (F) or no canalicular structure despite tight junctions connecting the hepatocyte to the adjacent biliary epithelial cell (F′). These areas are outlined with dashed red lines and/or labeled with an asterisk for possible canaliculi with abnormal structure. (F″) A dashed yellow line outlines excessive extracellular space filled with electron-dense material. Yellow arrowhead indicates bile salt deposit. Hep, hepatocyte; BEC, biliary epithelial cell; c, canaliculi; TJ, tight junction (n=3 wild type; n=3 stk3−/−). All images are of 16 dpf larvae. PHENOTYPE:
|
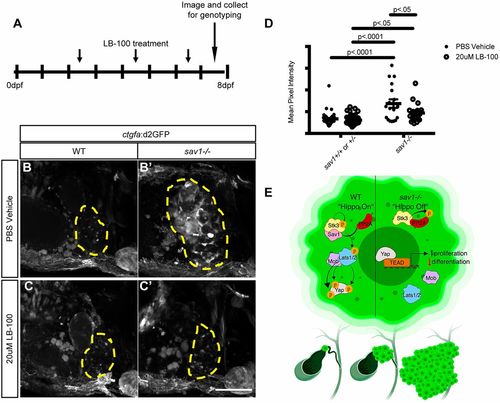
Phosphatase PP2A plays an inhibitory role in zebrafish Hippo signaling. (A) Schematic of LB100 treatment. (B-C′) Images of ctgfa:d2GFP+ wild-type and sav1−/− larvae at 7 dpf, treated with PBS or 20 µM LB100; liver is indicated by a dashed yellow line. Scale bar: 100 μm. (D) Mean pixel intensity of ctgfa:d2GFP reporter in livers, as outlined in B. Data are mean±s.d. Two-way ANOVA with Tukey's multiple comparisons, P values are as indicated. PBS sav1+/+ or sav1+/−, n=42; PBS sav1−/−, n=18; 20 µM LB100 sav1+/+ or sav1+/−, n=41; 20 µM LB100 sav1−/−, n=18. (E) Model for PP2A function in Hippo pathway signaling of the biliary system. |
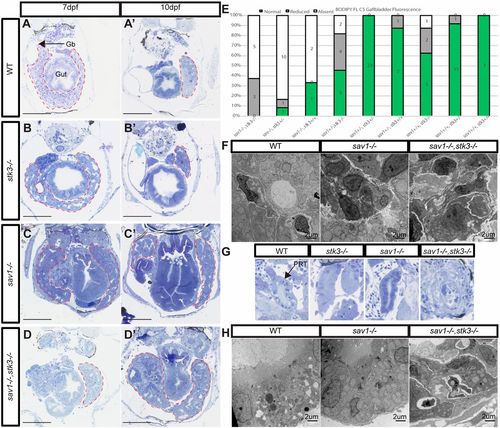
sav1 and stk3 display a synergistic genetic interaction. (A-D′) Toluidine Blue stained Epon sections of liver and gallbladder in wild-type, sav1−/−, stk3−/− and sav1−/−;stk3−/− larvae at 7 and 10 dpf. Gb, gallbladder. Red dashed lines outline the liver. Scale bars: 100 μm. (E) Ratiometric analysis at 8 dpf of BODIPY FL C5 gallbladder uptake in larvae from a sav1+/−;stk3+/− incross. (F) TEM of wild-type, sav1−/− and sav1−/−;stk3−/− Epon sections at 10 dpf reveals the most severe phenotype in sav1−/−;stk3−/− larvae. (G) Toluidine Blue stained epon sections of proximal renal tubules in wild-type, sav1−/−, stk3−/− and sav1−/−;stk3−/− larvae at 10 dpf. PRT, proximal renal tubule. Only double mutants display a dysplastic and fibrotic phenotype. (H) TEM of larvae from G. PHENOTYPE:
|

ZFIN is incorporating published figure images and captions as part of an ongoing project. Figures from some publications have not yet been curated, or are not available for display because of copyright restrictions. |
|
ZFIN is incorporating published figure images and captions as part of an ongoing project. Figures from some publications have not yet been curated, or are not available for display because of copyright restrictions. EXPRESSION / LABELING:
|
|
ZFIN is incorporating published figure images and captions as part of an ongoing project. Figures from some publications have not yet been curated, or are not available for display because of copyright restrictions. PHENOTYPE:
|
|
ZFIN is incorporating published figure images and captions as part of an ongoing project. Figures from some publications have not yet been curated, or are not available for display because of copyright restrictions. PHENOTYPE:
|
|
Unillustrated author statements PHENOTYPE:
|