
- Title
-
Opposing p53 and mTOR/AKT promote an in vivo switch from apoptosis to senescence upon telomere shortening in zebrafish
- Authors
- El Maï, M., Marzullo, M., de Castro, I.P., Ferreira, M.G.
- Source
- Full text @ Elife
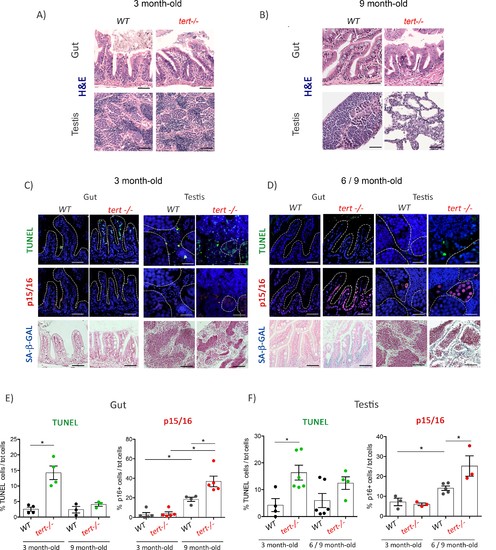
Proliferative tissues of tert-/- zebrafish undergo an in vivo switch from apoptosis to senescence with age.(A-B) Representative haematoxylin and eosin-stained sections of gut (scale bar: 40 µm) and testis (scale bar: 25 µm) from 3-month-old (A) or 9-month-old (B) of WT and tert-/- siblings. While no macroscopic tissue defects are distinguishable at 3 months (N = 3), 9 month tert-/- (N = 3) exhibit altered gut and testis structures. (C-D) Representative immunofluorescence images of apoptosis (TUNEL) or senescence (p15/16 and SA-β-GAL) of gut and testis from 3 month (C) or 6–9 month-old (D) WT and tert-/- siblings (N = 3–6 each)(scale bar: 25 µm). Dashed outlines locate cysts of spermogonia cells or spermatocytes (testis) or villi (gut). At 3 months, both tissues show an increased number of apoptotic cells in tert-/- compared to WT. At that age, no signs of senescence are visible in these tissues. However, senescent cells appear in the gut and testis of 6–9 month-old tert-/- fish depicting a switch between apoptosis and senescence. (E-F) Quantification of the percentage of TUNEL and p15/16 positive cells in 3 month and 6–9 month-old tert-/- or WT. Data are represented as mean ± SEM. * p-value<0.05; using the Mann-Whitney test. |
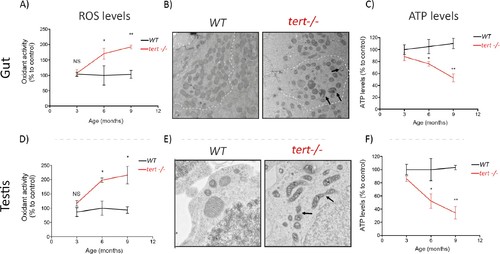
Gut and testis of tert-/- zebrafish are characterised by a time-dependent mitochondrial defects, increase of ROS levels and reduction of ATP levels.Gut and testis of tert-/- exhibit a time dependent increase in ROS levels (A and D) and decrease of ATP levels (C and F) (N >= 3 fish per time point per genotype), determined by 2′,7′-Dichlorofluorescin diacetate (DCFDA) measurement and the CellTiter-Glo Luminescent Cell Viability Assay, respectively. Representative EM images (B and E) of these tissues at 9 months revealed fragmented mitochondrial ultrastructure (arrows) and rounded and swollen mitochondria denoting perturbed cristae (arrows) in tert-/- zebrafish (N = 3 fish). Data are represented as mean ± SEM (* p-value<0.05; ** p-value<0.01, using the Mann-Whitney test). |
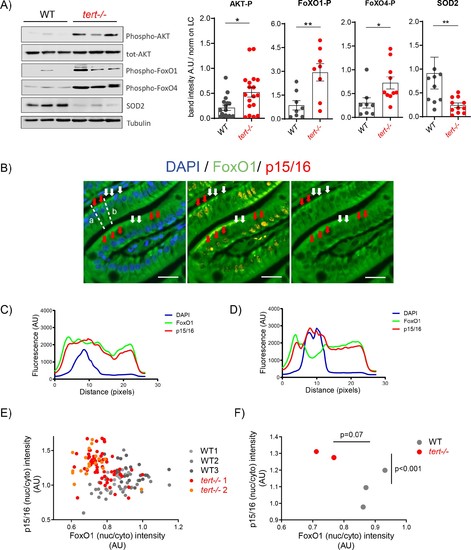
Activation of AKT in older tert-/- mutants results in FoxO1/4 translocation to the cytoplasm and reduction of mitochondria OxPhos defenses.(A) Activation of Akt leads to the inhibitory phosphorylation of FoxO1 and FoxO4 and corresponding reduction of SOD2 expression in 9-month-old tert-/- mutants. Western blot analysis for AKT-P, total AKT, FoxO1-P, FoxO4-P and SOD2 from gut extracts of 9-month-old tert-/- mutant and WT siblings (N >= 9). Representative western blot (left panel) and corresponding normalised quantification (right panel). Data are represented as mean ± SEM. * p-value<0.05; ** p-value<0.01 using the Mann-Whitney test. (B-F) Activation of Akt in older tert-/- mutant gut enterocytes leads to the translocation of FoxO1 from the nucleus to the cytoplasm and complementary accumulation p15/16 senescence marker. Total FoxO1 and p15/16 co-immunofluorescence staining in the gut of 9-month-old tert-/-and WT siblings. (B) Representative image of 9-month-old tert-/- gut. Red arrows: low nuclear FoxO1 levels in p15/16 positive cells; White arrows: high nuclear FoxO1 levels in p15/16 negative cells; scale bar: 20 µm. Dashed lines a and b depict the regions of fluorescence intensity quantification of cells analysed in D and C, respectively. (C-D) Histograms representing fluorescence quantification of DAPI, FoxO1 and p15/16 across a p15/16 positive (dashed line b) or p15/16 negative cells (dashed line a). (E) Cell analysis: High p15/16 correlates with low FoxO1 nuclear/cytoplasmic fluorescence intensity in each gut cell of tert-/- mutants. Analysis performed per cell basis (WT N = 3; tert-/- N = 2; at least 69 cells per genotype were analysed). (F) Fish analysis: On average, 9-month-old tert-/- fish (N = 2) contain more ‘low FoxO1/high p15/16’ cells than WT siblings (N = 3). Data are represented as mean per sample. p-values were calculated using a 2-factor ANOVA test. |
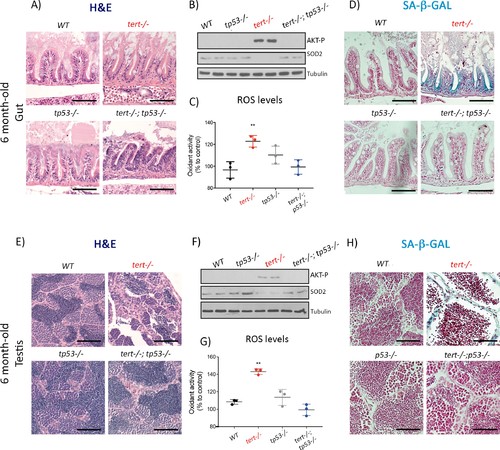
Mutation of p53 prevents short telomeres-induced tissue degeneration, Akt activation, ROS accumulation and induction of senescence.(A and E) Representative haematoxylin and eosin-stained sections of gut (A) (scale bar: 40 µm) and testis (E) (scale bar: 25 µm) from 6-month-old WT, tert-/-, tp53-/- and tert-/- tp53-/- siblings (N = 3 fish each);. Mutation of tp53 in tert-/- fish rescues short-telomere induced tissue defects. (B and F) Representative western blot analysis of AKT-p and SOD2 in gut (B) and testis (F) (N = 2 fish each). Mutation of tp53 in tert-/- fish prevents phosphorylation of AKT and downstream downregulation of SOD2 leading to a rescue of increased ROS levels (C and G; N = 3 fish per genotype). (D and H) Representative images of SA-β-GAL staining of gut (scale bar: 40 µm) (D) and testis (scale bar: 25 µm) (H) from 6 month-old WT, tert-/-, p53-/- and tert-/- p53-/- siblings (N = 3 fish). Data are represented as mean ± SEM (** p-value<0.01, using t-test). |
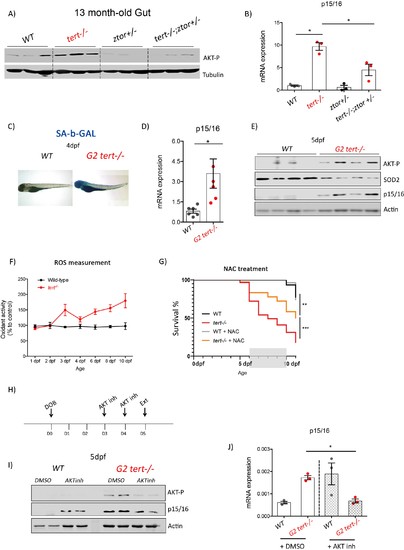
Genetic and pharmacological inhibition of AKT prevents short telomere-induced senescence.(A) Heterozygous mutation of zTOR counteracts telomere-shortening-induced Akt activation, leading to inhibition of p15/16 expression. Western blot analysis of AKT-P and (B) RT-qPCR analysis of p15/16 mRNA levels in 13-month-old gut of WT, tert-/-, ztor+/-and tert-/- ztor+/- fish (N = 3 fish). (C-F) Second generation (G2) tert-/- mutant larvae with extremely short telomeres show phenotypes associated with premature aging, as described in Figures 1, 2 and 3. (C) Representative images of SA-β-GAL staining of WT and second generation (G2) tert-/- mutant four dpf larvae. (D) RT-qPCR analysis of p15/16 mRNA levels (N = 6), E) Western blot analysis of AKT-P, SOD2, p15/16 (N = 4) and (F) ROS levels measurements determined by DCFDA assay (N = 3). G) Survival curve of G2 tert-/-upon NAC (40 µM from day 6 to 10) treatment (WT N = 31; WT+NAC N = 27; G2 tert-/- N = 61; G2 tert-/- +NAC N = 36 fish; ** p-value<0.01; ** p-value<0.01 using Log-Rank test). (H-J) Pharmacological inhibition of AKT rescues telomere-shortening induced p15/16 expression. (H) Experimental scheme of pharmacological inhibition of AKT in G2 tert-/-. (I) Western blot analysis of AKT-P and p15/16 and (J) RT-qPCR analysis of p15/16 mRNA levels of G2 tert-/- and WT treated with AKT inhibitor. All RT-qPCR graphs are representing mean ± SEM mRNA fold increase after normalisation to rpl13a gene expression levels (* p-value<0.05; ** p-value<0.01, using t-test). |
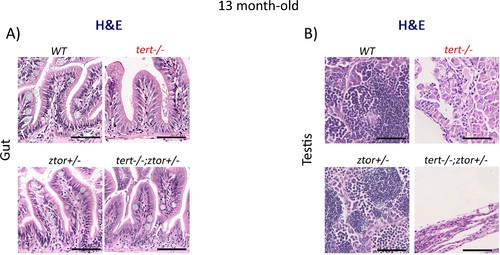
ztor haploinsufficiency is not sufficient to suppress tissue defects in tert-/- zebrafish.The absence of one copy of the ztor gene is not sufficient to rescue the morphological defects observed in the tert-/- at 13 months of age. (A and B) Representative haematoxylin and eosin-stained sections of gut (scale bar = 40 µm) (A) and testis (scale bar = 25 µm) (B) from 13-month-old WT, tert-/-, ztor+/- and tert-/- ztor +/- siblings (N = 3 fish each). |