
|
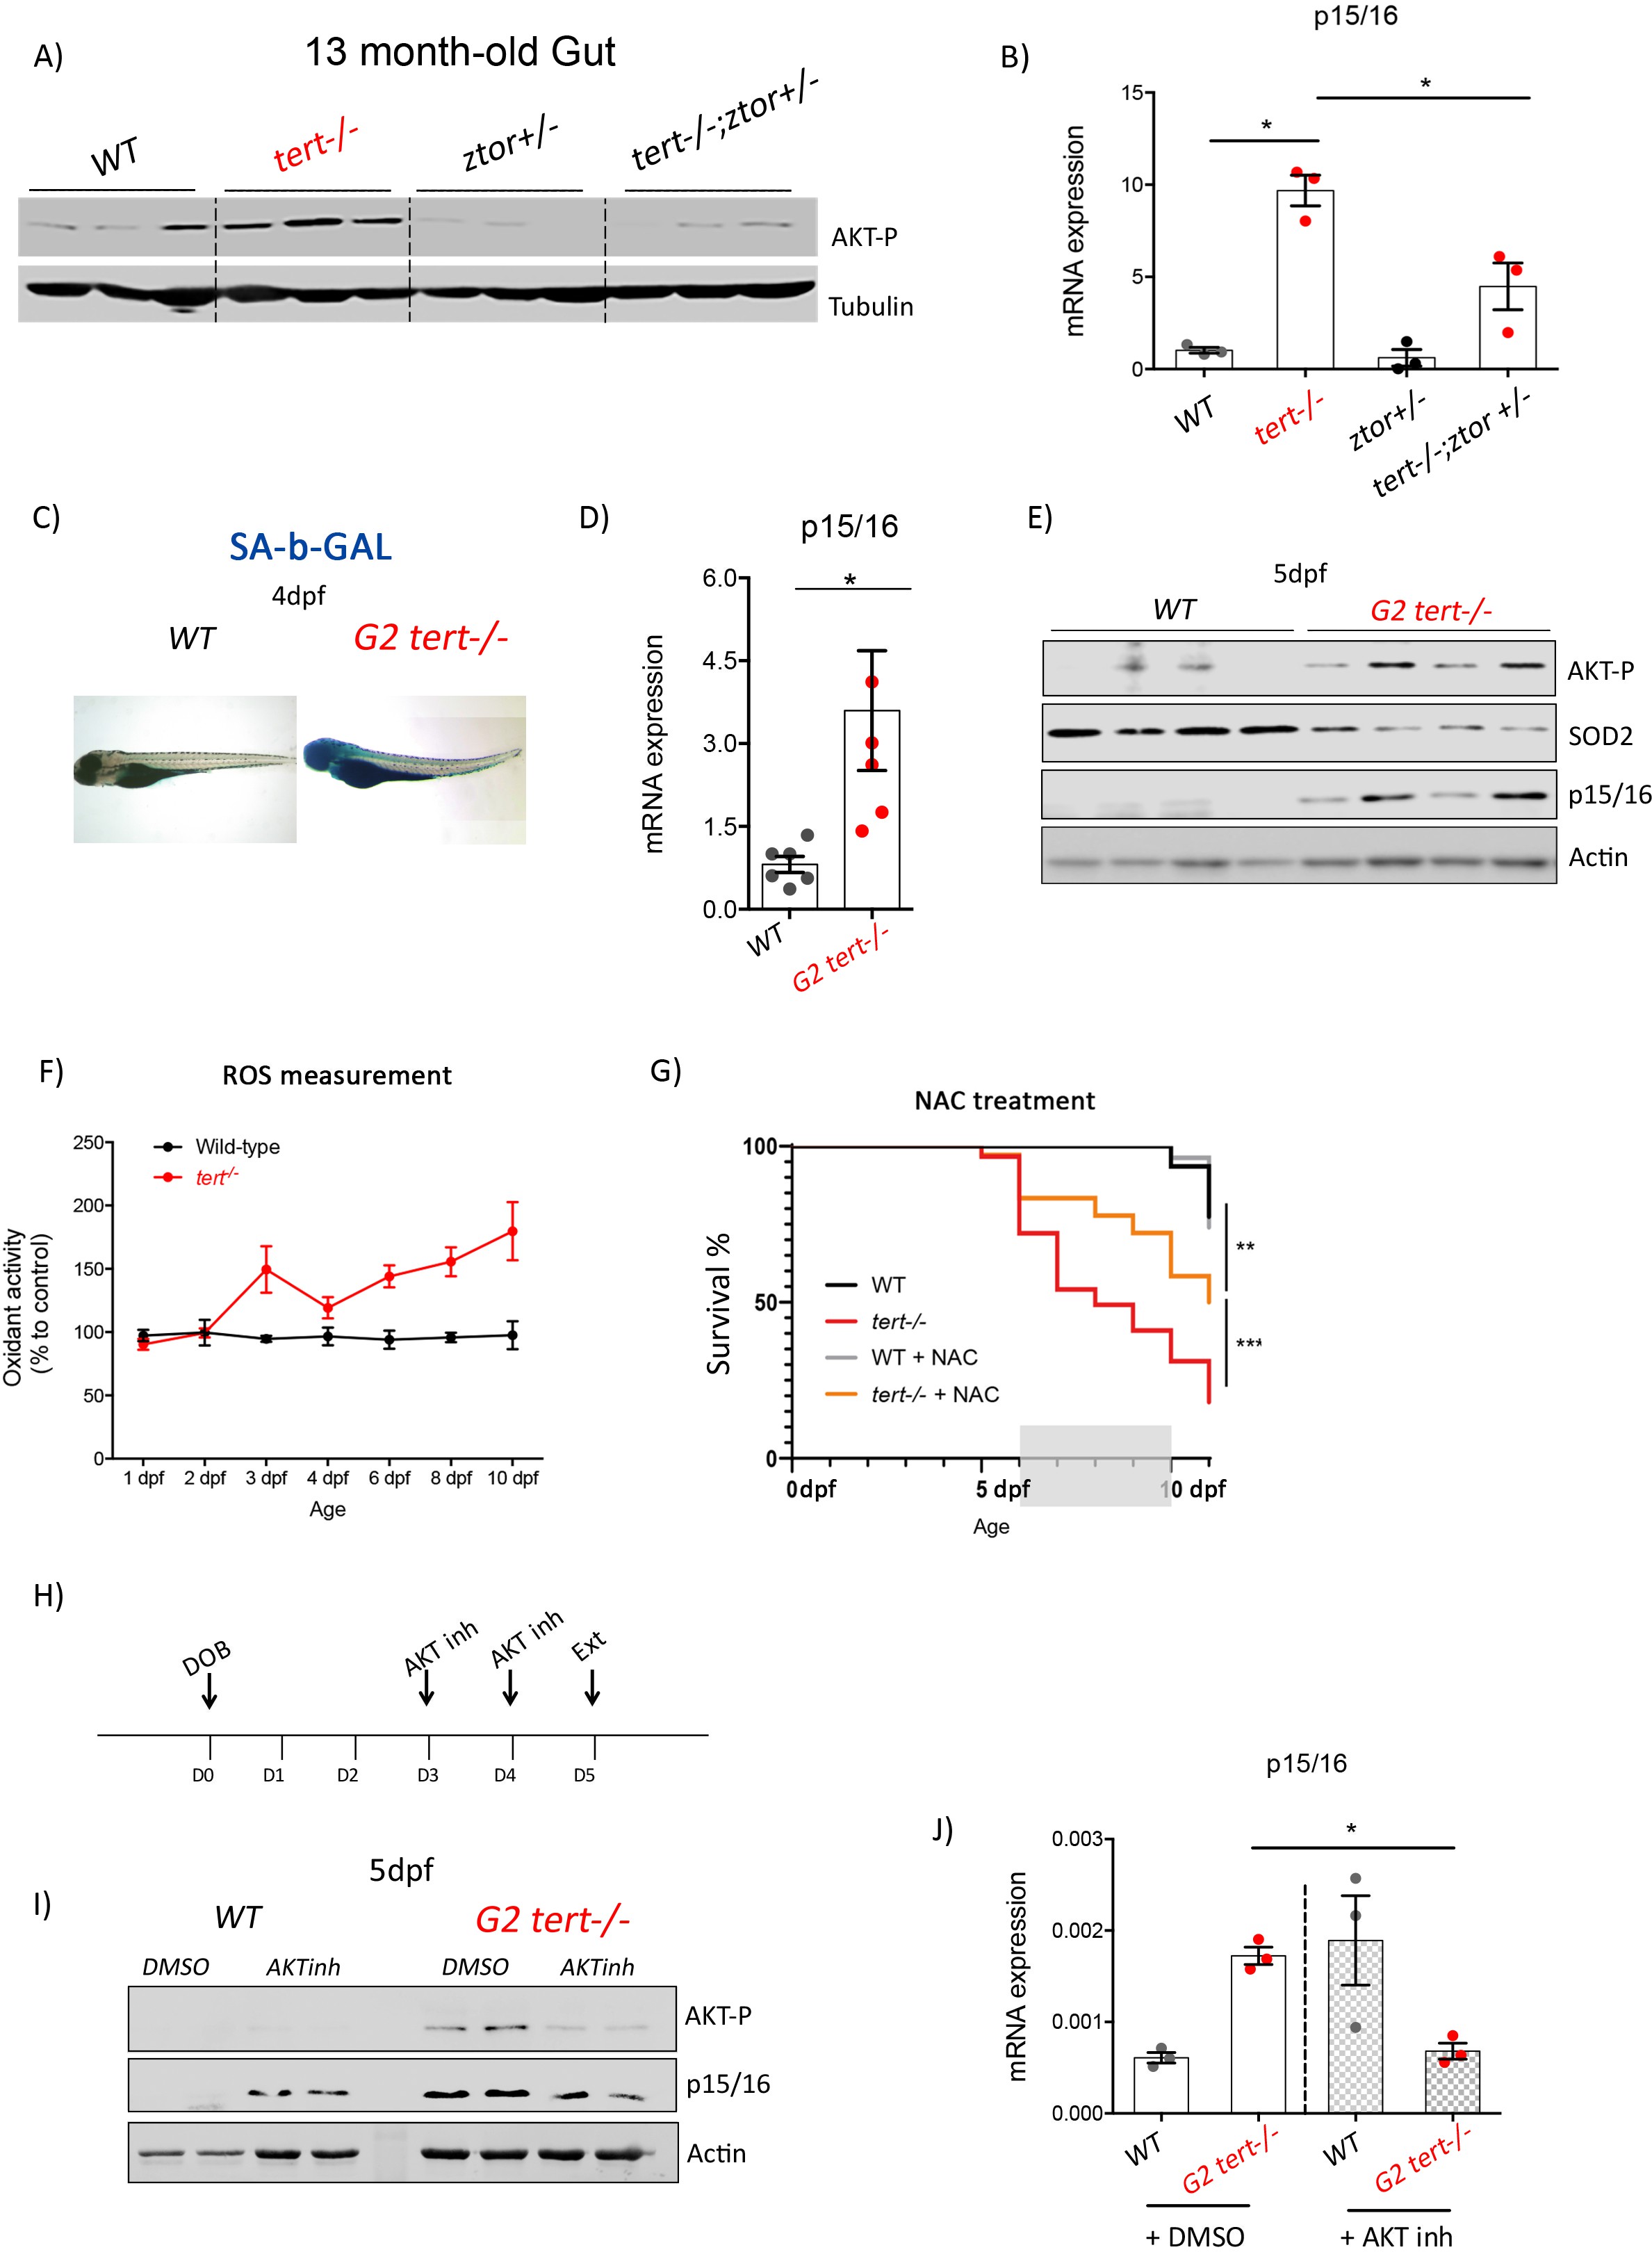
Fig. 6
Genetic and pharmacological inhibition of AKT prevents short telomere-induced senescence.
(A) Heterozygous mutation of zTOR counteracts telomere-shortening-induced Akt activation, leading to inhibition of p15/16 expression. Western blot analysis of AKT-P and (B) RT-qPCR analysis of p15/16 mRNA levels in 13-month-old gut of WT, tert-/-, ztor+/-and tert-/- ztor+/- fish (N = 3 fish). (C-F) Second generation (G2) tert-/- mutant larvae with extremely short telomeres show phenotypes associated with premature aging, as described in Figures 1, 2 and 3. (C) Representative images of SA-β-GAL staining of WT and second generation (G2) tert-/- mutant four dpf larvae. (D) RT-qPCR analysis of p15/16 mRNA levels (N = 6), E) Western blot analysis of AKT-P, SOD2, p15/16 (N = 4) and (F) ROS levels measurements determined by DCFDA assay (N = 3). G) Survival curve of G2 tert-/-upon NAC (40 µM from day 6 to 10) treatment (WT N = 31; WT+NAC N = 27; G2 tert-/- N = 61; G2 tert-/- +NAC N = 36 fish; ** p-value<0.01; ** p-value<0.01 using Log-Rank test). (H-J) Pharmacological inhibition of AKT rescues telomere-shortening induced p15/16 expression. (H) Experimental scheme of pharmacological inhibition of AKT in G2 tert-/-. (I) Western blot analysis of AKT-P and p15/16 and (J) RT-qPCR analysis of p15/16 mRNA levels of G2 tert-/- and WT treated with AKT inhibitor. All RT-qPCR graphs are representing mean ± SEM mRNA fold increase after normalisation to rpl13a gene expression levels (* p-value<0.05; ** p-value<0.01, using t-test).