
Fig. 4
- ID
- ZDB-FIG-200522-17
- Publication
- El Maï et al., 2020 - Opposing p53 and mTOR/AKT promote an in vivo switch from apoptosis to senescence upon telomere shortening in zebrafish
- Other Figures
- All Figure Page
- Back to All Figure Page
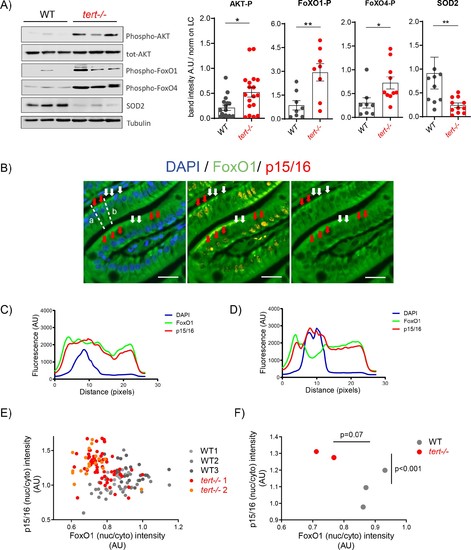
Activation of AKT in older tert-/- mutants results in FoxO1/4 translocation to the cytoplasm and reduction of mitochondria OxPhos defenses.(A) Activation of Akt leads to the inhibitory phosphorylation of FoxO1 and FoxO4 and corresponding reduction of SOD2 expression in 9-month-old tert-/- mutants. Western blot analysis for AKT-P, total AKT, FoxO1-P, FoxO4-P and SOD2 from gut extracts of 9-month-old tert-/- mutant and WT siblings (N >= 9). Representative western blot (left panel) and corresponding normalised quantification (right panel). Data are represented as mean ± SEM. * p-value<0.05; ** p-value<0.01 using the Mann-Whitney test. (B-F) Activation of Akt in older tert-/- mutant gut enterocytes leads to the translocation of FoxO1 from the nucleus to the cytoplasm and complementary accumulation p15/16 senescence marker. Total FoxO1 and p15/16 co-immunofluorescence staining in the gut of 9-month-old tert-/-and WT siblings. (B) Representative image of 9-month-old tert-/- gut. Red arrows: low nuclear FoxO1 levels in p15/16 positive cells; White arrows: high nuclear FoxO1 levels in p15/16 negative cells; scale bar: 20 µm. Dashed lines a and b depict the regions of fluorescence intensity quantification of cells analysed in D and C, respectively. (C-D) Histograms representing fluorescence quantification of DAPI, FoxO1 and p15/16 across a p15/16 positive (dashed line b) or p15/16 negative cells (dashed line a). (E) Cell analysis: High p15/16 correlates with low FoxO1 nuclear/cytoplasmic fluorescence intensity in each gut cell of tert-/- mutants. Analysis performed per cell basis (WT N = 3; tert-/- N = 2; at least 69 cells per genotype were analysed). (F) Fish analysis: On average, 9-month-old tert-/- fish (N = 2) contain more ‘low FoxO1/high p15/16’ cells than WT siblings (N = 3). Data are represented as mean per sample. p-values were calculated using a 2-factor ANOVA test. |