
- Title
-
The Effect of the Chorion on Size-Dependent Acute Toxicity and Underlying Mechanisms of Amine-Modified Silver Nanoparticles in Zebrafish Embryos
- Authors
- Chen, Z.Y., Li, N.J., Cheng, F.Y., Hsueh, J.F., Huang, C.C., Lu, F.I., Fu, T.F., Yan, S.J., Lee, Y.H., Wang, Y.J.
- Source
- Full text @ Int. J. Mol. Sci.
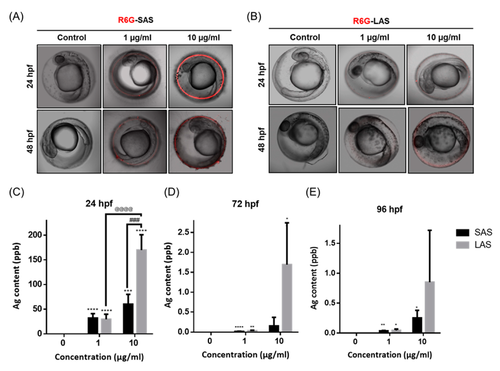
The metal accumulation of SAS and LAS. Zebrafish embryo were exposed to 1, 10 µg/mL R6G conjugated (A) SAS (B) LAS at 24–48 hpf. Red fluorescence signals represent deposition of AgNPs. The retention of silver in embryos at (C) 24, (D) 72, (E) 96 hpf. The level of silver ion was detected by atomic absorption spectrophotometer analyses. The experiment was performed thrice using 30 embryos each. The values are presented as the mean ± SEM. Values significantly different from the control are indicated by asterisks (one-way ANOVA, followed by a t-test: * p< 0.05, ** p < 0.01, *** p < 0.001 and **** p < 0.0001). The significantly difference between SAS and LAS are indicated by pound sign (one-way ANOVA, followed by a t-test ### p < 0.001). The significantly difference between LAS 1 µg/mL and LAS 10 µg/mL groups are indicated by the at sign (one-way ANOVA, followed by a t-test @@@@ p < 0.0001). |

The chorion inner/outer membrane of SAS/LAS-treated zebrafish embryos. Zebrafish embryos were observed via SEM after exposure to (A) 10 µg/mL SAS and LAS at 48 hpf. The backscattered electrons of the (B) outer layer and (C) inner layer membrane. The white dots indicate the accumulation of LAS. (D) The diameter of the chorion inner membrane pores was approximately 0.77 μm for the control, 0.78 μm for SAS and 0.94 μm for LAS. |

Malformation of zebrafish embryos exposed to LAS and SAS. (A) The SAS/LAS-treated embryos (0, 0.1, 1, 10 μg/mL) revealed different malformed phenotypes at 96 hpf. J, jaw malformation; PE, pericardial edema; OY, opaque yolk; AC, axial curvature; Y, yolk sac edema; E, eye malformation. (B) Quantification of the survival rate and specific malformation rate, including notochord malformation, yolk edema, axis malformation, and heart malformation. The total malformation indicates the sum of the specific malformation rate. The values are presented as the mean ± SEM. |
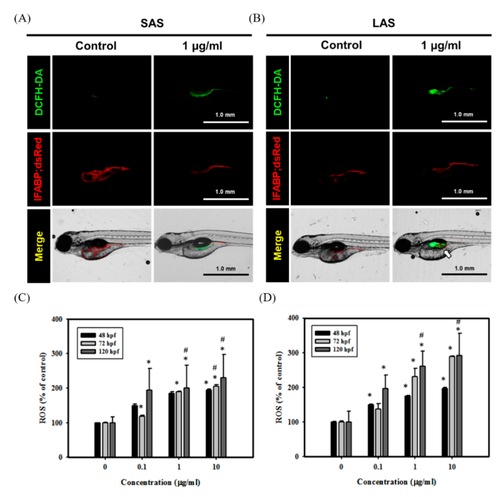
SAS/LAS induced excessive ROS in zebrafish embryos and damaged the intestinal region. Transgenic zebrafish (Tg(IFABP;dsRed)) embryos were treated with 1 µg/mL of (A) SAS and (B) LAS for observing the intestinal region and ROS production at 120 hpf. The ROS levels were analyzed via DCFH-DA assay. GFP fluorescence signals indicate ROS. RFP fluorescence signals represent the intestinal region. The white arrow indicates the excessive ROS in LAS group. ROS production of (C) SAS- (D) LAS-treated groups (0, 0.1, 1, and 10 µg/mL) were quantified at 48, 72 and 120 hpf. Quantification of ROS levels was performed with TissueQuest software. The values are presented as the means ± SEM. Values that are significantly different from the control are indicated by asterisks (one-way ANOVA, followed by a t-test: *, p< 0.05, control versus exposed groups. #, p< 0.05). |
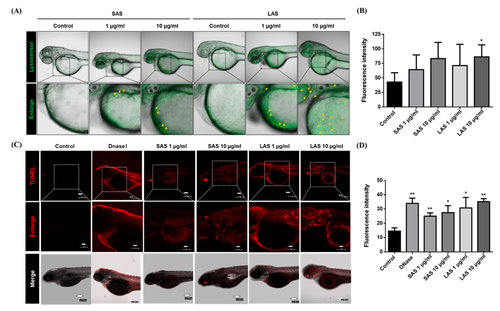
Effect of SAS/LAS on lysosomal activity and apoptosis. (A) 4 hpf zebrafish embryos were treated with SAS, LAS (0, 1, 10 μg/mL) and stained by Lysosensor, at 48 hpf. The green color and arrows represent upregulation of lysosomal activity. (B) The quantification of lysosensor fluorescence intensity (C) The zebrafish embryos treated SAS/LAS (0, 1, 10 μg/mL) were conducted at 72 hpf. Dnase I is the positive control of TUNEL assay. Red color represents apoptotic cell. Apoptotic cell mainly distributed to axis, yolk sac and head region. The scale bars in top and bottom panel (TUNEL and Merge) and middle panel (Enlarge) represents 100 μm and 200 μm respectively. (D) The quantification of TUNEL fluorescence intensity. The values are presented as the mean ± SEM. Values that are significantly different from the control are indicated by asterisks (one-way ANOVA, followed by a t-test: * p < 0.05 and ** p < 0.01). |