
Fig. 8
- ID
- ZDB-FIG-200507-25
- Publication
- Chen et al., 2020 - The Effect of the Chorion on Size-Dependent Acute Toxicity and Underlying Mechanisms of Amine-Modified Silver Nanoparticles in Zebrafish Embryos
- Other Figures
- All Figure Page
- Back to All Figure Page
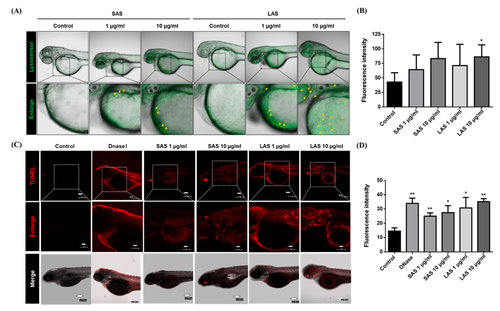
Effect of SAS/LAS on lysosomal activity and apoptosis. (A) 4 hpf zebrafish embryos were treated with SAS, LAS (0, 1, 10 μg/mL) and stained by Lysosensor, at 48 hpf. The green color and arrows represent upregulation of lysosomal activity. (B) The quantification of lysosensor fluorescence intensity (C) The zebrafish embryos treated SAS/LAS (0, 1, 10 μg/mL) were conducted at 72 hpf. Dnase I is the positive control of TUNEL assay. Red color represents apoptotic cell. Apoptotic cell mainly distributed to axis, yolk sac and head region. The scale bars in top and bottom panel (TUNEL and Merge) and middle panel (Enlarge) represents 100 μm and 200 μm respectively. (D) The quantification of TUNEL fluorescence intensity. The values are presented as the mean ± SEM. Values that are significantly different from the control are indicated by asterisks (one-way ANOVA, followed by a t-test: * p < 0.05 and ** p < 0.01). |