
Image
|
Figure Caption
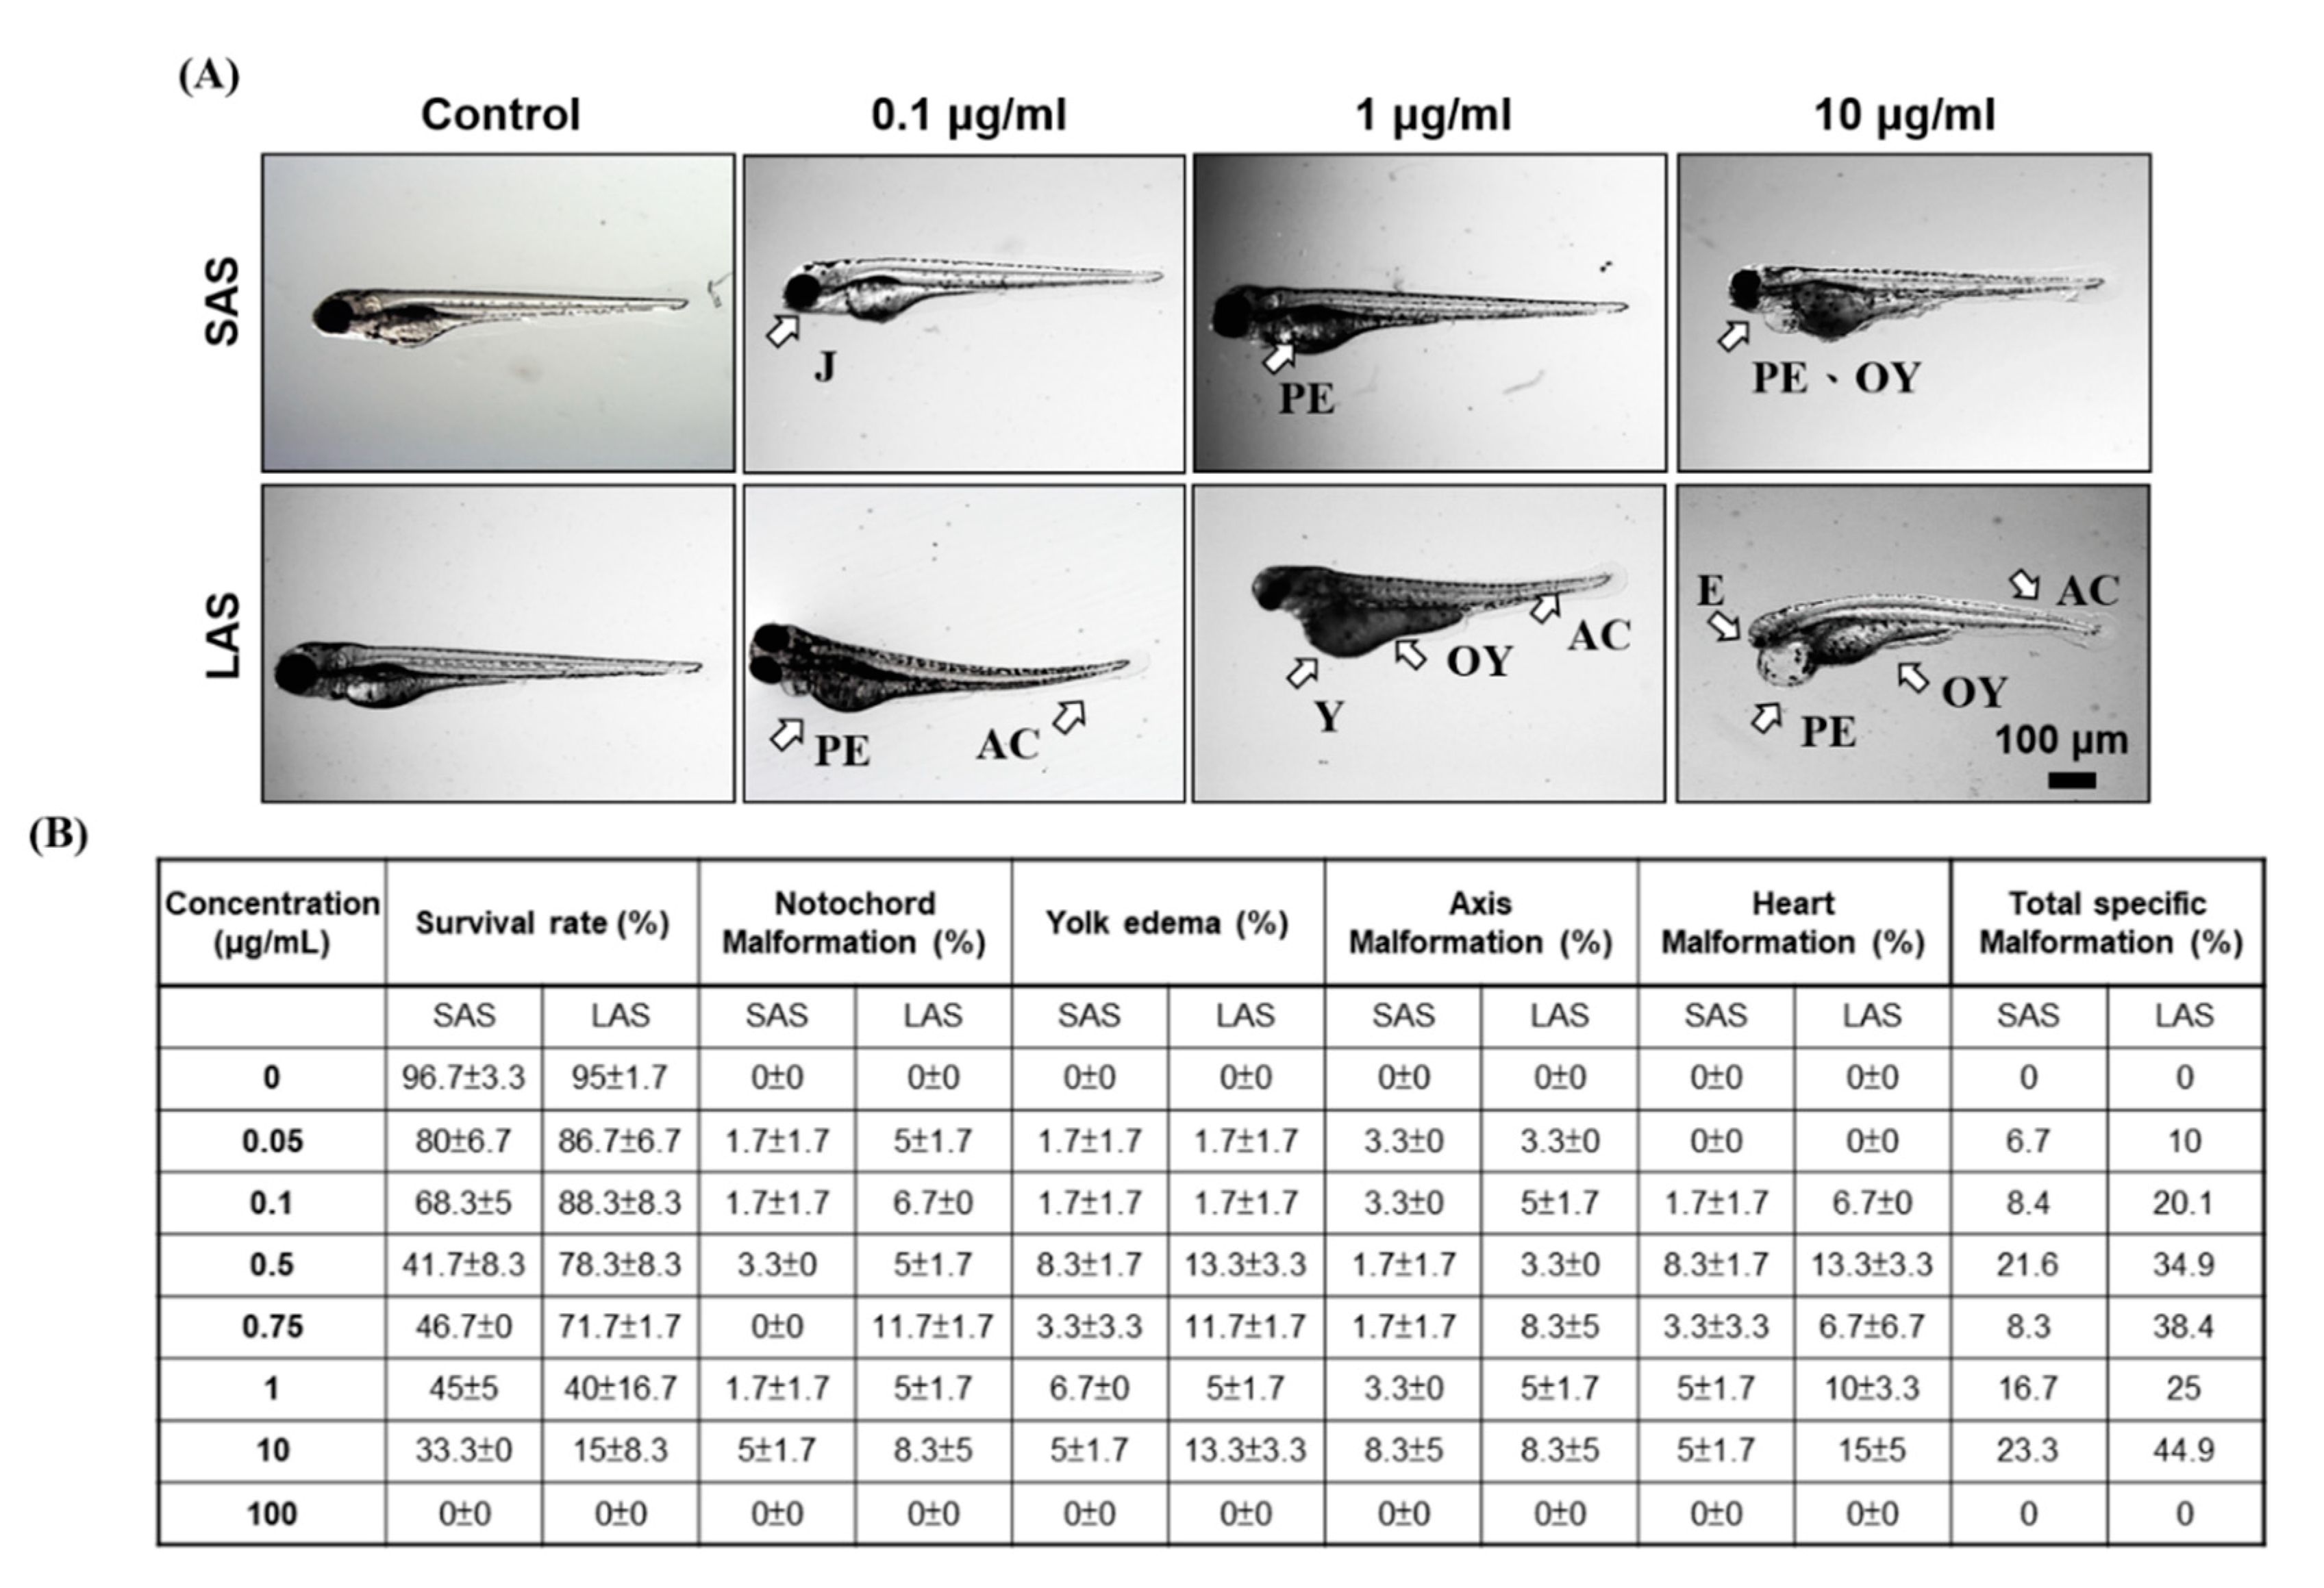
Fig. 6
Malformation of zebrafish embryos exposed to LAS and SAS. (A) The SAS/LAS-treated embryos (0, 0.1, 1, 10 μg/mL) revealed different malformed phenotypes at 96 hpf. J, jaw malformation; PE, pericardial edema; OY, opaque yolk; AC, axial curvature; Y, yolk sac edema; E, eye malformation. (B) Quantification of the survival rate and specific malformation rate, including notochord malformation, yolk edema, axis malformation, and heart malformation. The total malformation indicates the sum of the specific malformation rate. The values are presented as the mean ± SEM.
Acknowledgments
This image is the copyrighted work of the attributed author or publisher, and
ZFIN has permission only to display this image to its users.
Additional permissions should be obtained from the applicable author or publisher of the image.
Full text @ Int. J. Mol. Sci.