- Title
-
Spastin mutations impair coordination between lipid droplet dispersion and reticulum
- Authors
- Arribat, Y., Grepper, D., Lagarrigue, S., Qi, T., Cohen, S., Amati, F.
- Source
- Full text @ PLoS Genet.
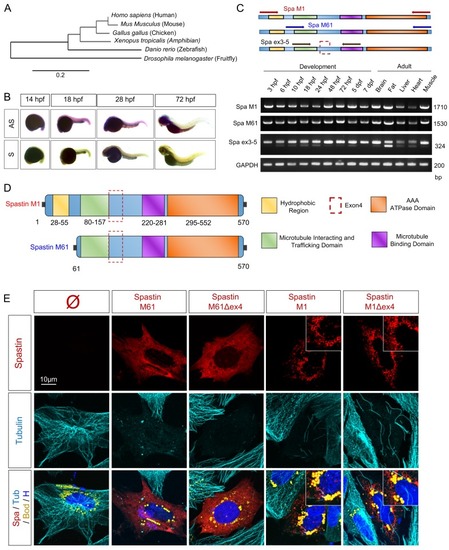
(A) Spastin phylogenic tree (designed from |
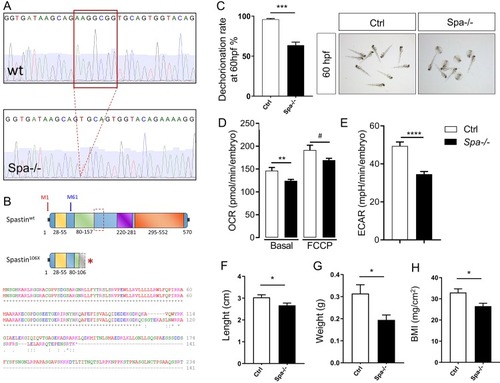
(A) Representation of Spastin deletion in CRISPR/Cas9 knockout zebrafish. (B) Spastin protein truncation resulting from CRISPR/Cas9 in KO model. (C) Dechorionation efficiency rate in 60 hpf embryos wild-type (Ctrl) compared with Spastin KO (Spa-/-). N = 3 experiments; n > 200 embryos per group. (D-E) Impact of Spastin deletion on oxygen consummation rate (OCR) and extra-cellular acidification rate (ECAR) in 48 hpf embryos. n = 11 embryos per group. (F-H) Length, weight, and Body Mass Index in 3 months old adult zebrafish. n = 7 animals per group. Bars are mean ± SEM, # |

(A) Confocal microscopy images of zebrafish embryonic cells from wild-type and Spastin KO animals (Ctrl and Spa-/-) treated with 300μM oleic acid (OA) for 18h before acquisition. Tubulin labeling corresponds to microtubules (red), Bodipy to lipid droplets (green) and Hoechst to nucleus (blue). (B) Quantification of LD area in embryonic cells. n = 23 cells Ctrl and n = 31 cells Spa-/-. (C-D) Quantification of LD number per cell (C) or in 100μm2 (D). n = 23 cells Ctrl and n = 31 cells Spa-/-. (E) Quantification of mean distance between individual LD and nucleus center. n = 23 cells Ctrl and n = 31 cells Spa-/-. (F) Oil red O staining in 6 dpf zebrafish larvae. Wild-type and Spastin KO were compared in basal conditions or after a 24h of OA in fish water. N = 3 experiments; n = 10 embryos per group. (G-J) Locomotion analyses in 6 dpf larvae (n = 24 larvae in each group) and after 24h administration of OA or Tunicamycin (TM) in fish water (n = 12 in each group). Zebrabox quantifications based on motion detection thresholds distinguishing slow (v) and fast velocity (V) as follow: 0<v<3mm/s (green) and V<6m/s (red). (K) RT-PCR detection of XBP1 splicing in 6 dpf zebrafish. (L) Schematic representation of slow versus fast twitch skeletal muscle distribution in adult zebrafish with respective electron micrographs delineating one fiber. (M) Electron micrographs taken in 8 months zebrafish skeletal muscle. Red arrow: sarcoplasmic reticulum, m: mitochondria. Bars are mean ± SEM, * |

(A) Schematic representation of human Spastin splice variants. (B) Coiled-coil prediction in Spastin isoforms (designed from |

Multispectral analysis of organelle size and number in U2OS cells expressing humans Spastin isoforms M1, M1Δex4, M87, M87Δex4 and the mutant M1H455R. (A-B) Quantification of lysosome (Lyso) number per cell and median size. (C-D) Quantification of LD number per cell and median size. (E-F) Quantification of peroxisome (Perox) number per cell and median size. (G) Quantification of ER area per cell. (H) Quantification of mitochondria (Mito) area per cell. (I) Quantification of organelle contact area fraction centered on ER. (J) Quantification of organelle contact area fraction centered on LDs. (K-M) Representative images of U2OS cells expressing mock (K), human Spastin M1 (L) and the mutant counterpart M1H455R (M). Scale bars, 10 μm. Box whisker plots, statistical tests are unpaired |

(A) Confocal microscopy images of HeLa cells overexpressing human Spastin M1 wild-type and mutant (H455R) treated with oleic acid (OA) for 18h. Nocodazole (Noco) and Taxol administration (12h) serve as control conditions. Cherry-tagged Spastin appears in red. Lamin A/C labeling corresponds to the nuclear compartment (green), Bodipy to LDs (magenta) and Hoechst to nucleus (blue). N = 4. (B-C) Quantification of LD number and size in HeLa cells treated with OA. n = 10 to 15 cells per condition. (D) Quantification of nuclear LDs in HeLa cells treated with OA. n = 10 to 15 cells per condition. (E-F) Confocal microscopy images of HeLa cells overexpressing human Spastin M1 isoforms treated with OA for 18h. Cherry-tagged Spastin appears in red. Calcineurin labeling corresponds to ER (green), acetylated Tubulin to microtubules (magenta) and Hoechst to nucleus (blue). (G) Schematic representation of ER shaping in presence of wild-type and mutant Spastin with subsequent impact on LD dispersion. In basal conditions, ER (green) follows a dynamic balance of elongation/retraction controlling the distribution of associated LDs (yellow) through the cell. Overexpression of wild-type Spastin M1 (red) triggers the retraction of ER leading to the accumulation of bigger LDs close to the nucleus. Mutated Spastin M1 (red) induces an abnormal elongation of ER along microtubules (magenta), resulting in a reduction of LD dispersion. Bars are mean ± SEM, * |
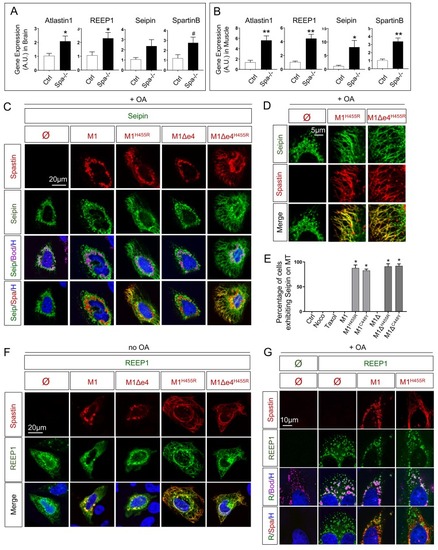
(A) Quantification of REEP1, Atlastin1, Spartin and Seipin transcript by qPCR in 8 months old zebrafish brain. n = 4 animals per group. (B) Quantification of REEP1, Atlastin1, Spartin and Seipin transcript by qPCR in 8 months old zebrafish skeletal muscle. n = 4 animals per group. (C-D) Confocal microscopy images of HeLa cells overexpressing human Seipin with Spastin M1 isoforms (wild-type and mutants) treated with oleic acid (OA) for 18h. Cherry-tagged Spastin appears in red, Seipin in green, LDs (Bodipy) in magenta and nucleus (Hoechst) in blue. (E) Percentage of cells exhibiting tubular ER along MTs. (F-G) Confocal microscopy images of HeLa cells overexpressing human REEP1 with Spastin M1 isoforms in basal conditions (F) or after 18h administration of OA (G). Cherry-tagged Spastin appears in red, REEP1 in green, LDs (Bodipy) in magenta and nucleus (Hoechst) in blue. Bars are mean ± SEM, # |