
- Title
-
Phosphoribosyl pyrophosphate synthetase polymerization influences lens fiber organization in zebrafish
- Authors
- Begovich, K., Yelon, D., Wilhelm, J.E.
- Source
- Full text @ Dev. Dyn.
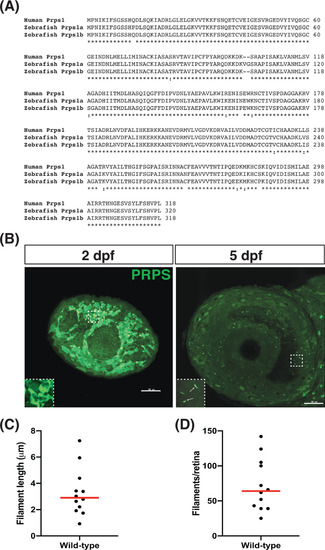
Phosphoribosyl pyrophosphate synthetase (PRPS) forms filaments in the retina at 5 days post fertilization (dpf). A, Protein sequence alignment (UniProt) of human PRPS (P60891) to zebrafish PRPS paralogs Prps1a (Q4KME9) and Prps1b (Q08CA5). Human PRPS1 has ~96% identity to both zebrafish paralogs. B, Antibody raised against human PRPS1 recognizes filaments at 5 dpf in the zebrafish eye. Representative maximum intensity projections of confocal images depict left eyes at 2 and 5 dpf stained for PRPS; rostral is to the left and dorsal is to the top. We note that we have never detected filament-like staining in the wild-type eye using the goat anti-rabbit secondary antibody in the absence of the anti-PRPS antiserum. Insets in bottom left corners show zoomed views of boxed areas. Scale bars: 50 μm. (n = 12 embryos for each stage). C, Graph plots the average length of the PRPS filaments observed in each eye examined at 5 dpf. Red line indicates the median value. D, Graph plots the number of PRPS filaments found in each eye examined at 5 dpf. Red line indicates the median value |
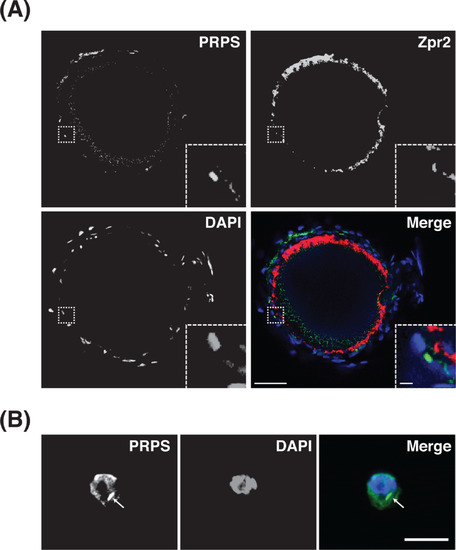
Phosphoribosyl pyrophosphate synthetase (PRPS) cytoplasmic filaments assemble in cells adjacent to the retinal pigmented epithelium (RPE). A, Single optical slice from a confocal z-stack shows a representative example of a 5 dpf eye stained for PRPS (green), Zpr2 RPE marker) (red), and 40,6-diamidino- 2-phenylindole (DAPI) (blue) and depicts PRPS filament formation in the cytoplasm of cells adjacent to the RPE layer. Rostral is to the left and dorsal is to the top. Insets in bottom right corners show zoomed views of boxed areas. Scale bars: 40 μm for main images, 3 μm for insets (n = 6 embryos). B, Representative maximum intensity projections of confocal images of a single cell, dissected from retinal tissue and stained for PRPS (green) and DAPI (blue), depict cytoplasmic localization of PRPS filaments. Retinas were dissected, subjected to trypsin treatment, and plated before being fixed and immunostained. Arrow indicates PRPS filament. Scale bar: 10 μm. (n = 3 eye dissections; ~30% of the dissociated cells exhibited PRPS filaments) EXPRESSION / LABELING:
|
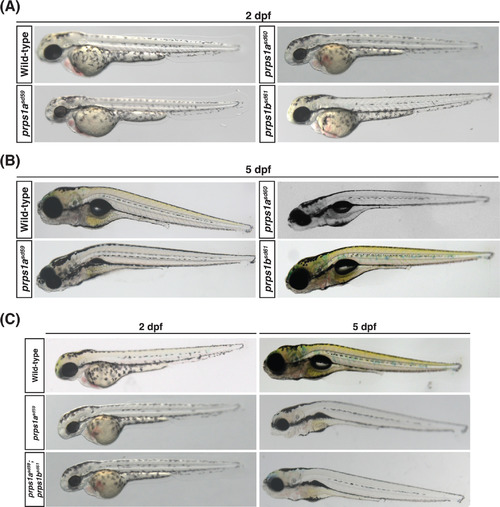
Loss of prps1a, not prps1b, generates eye, pigmentation, head, and swim bladder phenotypes. A, Representative bright-field images of wild-type, prps1a mutant, and prps1b mutant embryos at 2 dpf. Reduced eye size is observed in both prps1a mutants, but not in prps1b mutants (n = 16 embryos for each genotype). B, Representative bright-field images of wild-type, prps1a mutant, and prps1b mutant embryos at 5 dpf. Reduced eye and head size, reduced swim bladder inflation, and reduced xanthophore-derived yellow pigmentation are observed in prps1a mutants, but not in prps1b mutants (n = 16 embryos for each genotype). C, Representative bright-field images of wild- type, prps1asd59 mutant, and prps1asd59;prps1bsd61 double mutant embryos at 2 and 5 dpf. No additional phenotypes are observed in the double mutants compared to prps1asd59 mutants alone (n = 12 embryos for each genotype and stage) |
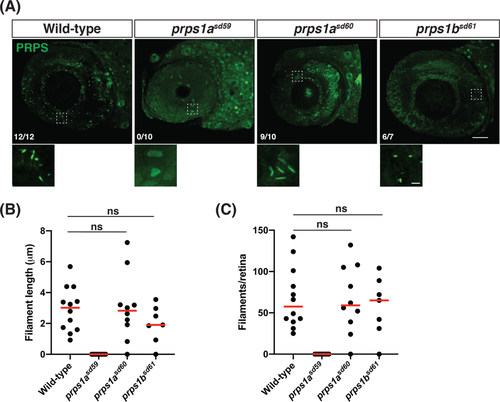
Truncation of prps1a prevents phosphoribosyl pyrophosphate synthetase (PRPS) filament formation. A, Representative maximum intensity projections of confocal images from wild-type, prps1a mutant, and prps1b mutant eyes at 5 dpf, stained for PRPS. Rostral is to the left and dorsal is to the top; zoomed views of boxed areas are displayed below each panel. Fractions indicate the number of embryos exhibiting PRPS filaments out of the number of embryos examined per genotype. Only prps1asd59 mutants failed to form PRPS filaments in the eye. Scale bars: 40 μm for main images, 3 μm for zoomed images. B, Graph plots the average length of the PRPS filaments observed in each wild-type, prps1a mutant, and prps1b mutant eye at 5 dpf. Red lines indicate median values (ns, no statistically significant difference between data sets). C, Graph plots the number of PRPS filaments found in each wild-type, prps1a mutant, and prps1b mutant eye at 5 dpf. Red lines indicate median values (ns, not significant) |
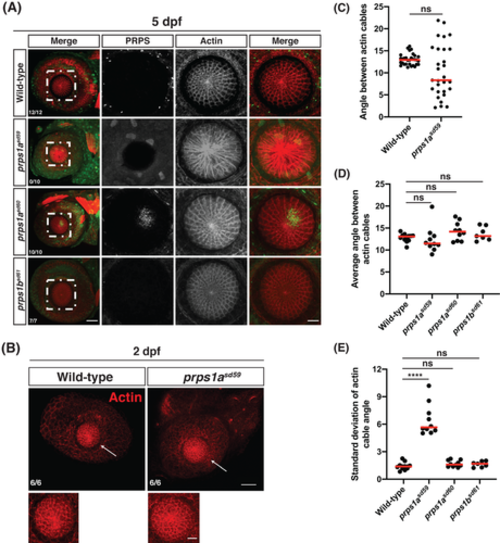
Loss of phosphoribosyl pyrophosphate synthetase (PRPS) filaments results in lens fiber disorganization. A, Representative maximum intensity projections of confocal images from wild‐type, prps1a mutant, and prps1b mutant eyes at 5 dpf, stained with PRPS (green) and rhodamine phalloidin (red). Rostral is to the left and dorsal is to the top; zoomed views of boxed areas from the first column are displayed in the following columns. Fractions indicate the number of embryos exhibiting a regularly‐spaced, lattice‐like actin array in the lens out of the number of embryos examined per genotype. While both prps1a mutants displayed abnormal PRPS signal in the lens, only prps1asd59 mutants exhibited a disorganized actin array in the lens fibers. Scale bars: 40 μm for first column, 20 μm for zoomed images. B, Representative maximum intensity projections of confocal images from wild‐type and prps1amutant eyes at 2 dpf, stained with rhodamine phalloidin. Rostral is to the left and dorsal is to the top; zoomed views of boxed areas are displayed below each panel. Arrows indicate lens fibers. Fractions indicate the number of embryos exhibiting a honeycomb‐like actin array in the lens out of the number of embryos examined per genotype. No defects were observed in prps1asd59 mutants at 2 dpf. Scale bars: 40 μm for main images, 10 μm for zoomed images. C, Graph plots the angles between adjacent radial actin cables in the lens fibers of one wild‐type and one prps1asd59 eye at 5 dpf. Red lines indicate median values. Although the distribution of angle sizes is much broader in the prps1asd59 eye, there is not a statistically significant difference between these data sets (ns, not significant). D, Graph plots the average angle size observed in each wild‐type, prps1a mutant, and prps1b mutant eye at 5 dpf. Red lines indicate median values. Average angle size is similar for all genotypes (ns, not significant). E, Graph plots the SD of the actin cable angles measured in each wild‐type, prps1a mutant, and prps1bmutant eye at 5 dpf. Red lines indicate median values. Wild‐type, prps1asd60, and prps1bsd61embryos displayed small SDs in angle size, whereas prps1asd59 embryos had much higher SD values, indicating the relative disorganization of the actin cable array in prps1asd59 mutants (****P < 0.0001; ns, not significant) |
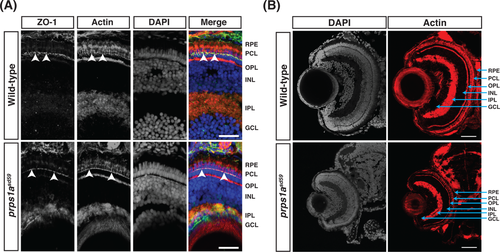
Cell polarity and retinal lamination are unaffected in prps1asd59 mutants. A, Representative maximum intensity projections of confocal images of transverse cryosections from wild‐type and prps1asd59 mutant embryos at 5 dpf, stained for ZO‐1 (green), actin (red), and 4′,6‐diamidino‐2‐phenylindole (DAPI) (blue). No change in ZO‐1 localization is observed in prps1asd59 mutants compared to wild‐type. Arrowheads indicate ZO‐1 localization to the apical membrane of the photoreceptor cell layer. GCL, ganglion cell layer; INL, inner nuclear layer; IPL, inner plexiform layer; OPL, outer plexiform layer; PCL, photoreceptor cell layer; RPE, retinal pigmented epithelium. Scale bars: 20 μm (n = 6 embryos for each genotype). B, Representative maximum intensity projections of confocal images of transverse cryosections from wild‐type and prps1asd59 mutant embryos at 5 dpf, stained for actin and DAPI. Retinal patterning is unaffected in prps1asd59 mutants. Scale bars: 20 μm (n = 6 embryos for each genotype) |