
- Title
-
Aberration correction for improving the image quality in STED microscopy using the genetic algorithm
- Authors
- Wang, L., Yan, W., Li, R., Weng, X., Zhang, J., Yang, Z., Liu, L., Ye, T., Qu, J.
- Source
- Full text @ Nanophotonics

Principle and experiment system of STED microscopy. (A) Focal spots of the excitation beam and the depletion beam, and their overlap in both XY plane and XZ plane. (B) Schematic of the STED imaging system. L, lens; HWP, half wave plate; GLP, Glan-laser polarizer; GR, glass rod; RR, retro reflector; M, mirror; DM, dichroic mirrors; Obj, objective lens; QWP, quarter wave plate; SMF, single mode fiber; PMF, polarization maintaining fiber; MMF, multimode fiber; DAQ, data acquisition device. |

Principle of genetic algorithm. (A) The flowchart of genetic algorithm for finding the best solution. (B) Two encoded forms on SLM in GA procedure. |

The correction of system-induced aberration by genetic algorithm. (A) The voltage change during the correction and the final corrected phase. (B, C) The comparison of scattering images of a gold nanoparticle between before and after aberration correction illuminated by Gaussian and donut-shaped depletion beam, respectively. Notes: green profiles in (B) and (C) are respective fit curves of normalized intensity. |
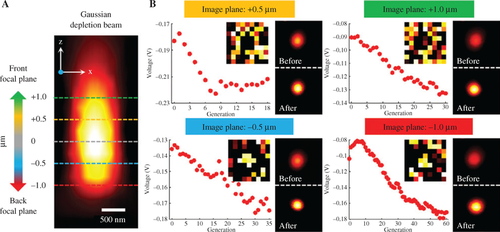
The verification of GA in correcting the artificial system aberration. (A) Scattering image of a nanoparticle illuminated by Gaussian depletion beam in XZ plane. (B) Aberration corrections at different defocusing planes (The voltage changes and the corrected phases, as well as the comparisons of scattering images of a gold nanoparticle between before and after aberration correction illuminated by Gaussian depletion beam). |

The improvement of image quality of fluorescent microspheres in STED microscopy. (A) Confocal and STED images at the depletion power of 19 mW before and after correcting system-induced aberration. (B) Normalized intensity profiles along two white dotted lines in (A), respectively. (C) The mean intensity of three fluorescence images. |

Zebrafish retina sample. Red balls are 150 nm diameter gold nanoparticles, and green balls are 100 nm diameter fluorescent microspheres. |

Full aberration correction in zebrafish samples. (A) Images of 100 nm fluorescent microspheres through zebrafish retina with the thickness of 24 μm, and the normalized intensity profiles along white dotted lines. (B) Images of 100 nm fluorescent microspheres though zebrafish embryos section with the thickness of 100 μm, and the normalized intensity profiles along white dotted lines. |
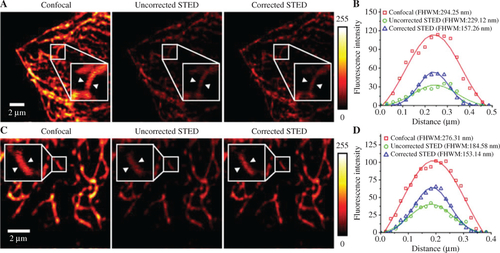
Full aberration correction in Hela cell sample. (A) Images of tubulin structures in a HeLa cell labeled with ATTO647N in the field of view of 15 × 15 μm2. (B) Fluorescence intensity profiles marked by white arrows in (A). (C) Images of tubulin structures in a HeLa cell labeled with ATTO647N in the field of view of 10 × 10 μm2. (D) Fluorescence intensity profiles marked by white arrows in (C). |